Dynamic Probability Trade Strategy

I
make it into an actual system and show the back testing you will face the truth before you lose your money or someone else's. then again there is nothing like real money trading to expose flaws the human eyes ignore in the chase of unearned money.
I do not share the esteem so many seem to hold for back testing. I do have a much greater regard however for real money trading—not only in exposing the flaws the human eyes ignore in the chase of unearned money, but also in confirming the validity of winning systems that others might try to convince traders to abandon for who knows what reasons.

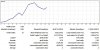
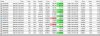
ScreenHunter_2583 Nov. 18 17.09.jpg

ScreenHunter_2584 Nov. 18 17.12.jpg

(Had GBP not gone crazy on Friday, I might have done even better.)
 
After a great deal of experimentation between November 2011 and November 2015, I developed what I regarded as a successful guerrilla warfare style of scalping the Forex market, which I called a Multiple Simple Moving Average Envelope (Ms. Mae’s) trade strategy.

Between August of 2016 and August 2018, I refined Ms. Mae’s strategy and called the modified version of my approach the Numerical Price Prediction (NPP) trading system.

Due to circumstances that took me away from full-time trading, I was forced to make an attempt to adapt NPP’s scalping methodology to more of a pseudo-swing style of trading, even though prior to this, all my attempts to trade profitably using anything other than a short-term approach to intraday trading proved futile.

However, unlike all my previous efforts, this time the majority of my "longer-term" trades (though usually no more than 24 hours) were ending with a positive result. This has motivated me to start a new thread (this one) for evaluating this recent offshoot of NPP, which I am calling Dynamic Probability Trading (DPT).

To oversimplify the system, DPT is built on typical price range from the perspective of three different time frames and on the intraday trend.

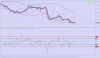
View attachment 194727

Despite warnings not to attempt to pick tops and bottoms, this is exactly what the system is designed to do.

The chart setup is essentially comprised of three proprietary price range envelopes and two proprietary moving averages, greatly simplifying my former arrangement. The envelopes are generated using statistical calculations based on a sampling of historical data.

In a nutshell, whenever the candlesticks make contact with the upper or lower band of a price range envelope, there is an increased likelihood that price will reverse direction—a likelihood that is heightened in proportion to the number of price range envelopes involved.

Reversals are confirmed via the moving averages, though in actual application, positions are entered and exited as dictated by what is happening on lower time-frame charts.

I am very hopeful that the system will continue to work, so the main function of this thread will be to help me maximize and standardize the way in which I employ it.

Without any modification of fitting, have you found instruments that statistically suited your method better than others.
Many might say, well there are only30 or so distinct markets for retail Joe but if you include stocks there are many more. Why not select or characterize instruments as historically good or bad. Character of an instrument can persist,for years.
just my gut feeling that a system such as yours ( looking for extremes then reversion) can be improved with market/stock selection.
Ie...what if AKS steel stock suited your method better than the JPY. Would you trade AKS?
 
Last edited:
Without any modification of fitting, have you found instruments that statistically suited your method better than others.
Many might say, well there are only30 or so distinct markets for retail Joe but if you include stocks there are many more. Why not select or characterize instruments as historically good or bad. Character of an instrument can persist,for years.
just my gut feeling that a system such as yours ( looking for extremes then reversion) can be improved with market/stock selection.
Ie...what if AKS steel stock suited your method better than the JPY. Would you trade AKS?

Have you found instruments that statistically suited your method better than others?

I have come to favor the price action of foreign currency pairs.

My gut feeling is that a system such as yours (looking for extremes then reversion) can be improved with market/stock selection. Why not select or characterize instruments as historically good or bad?

The system as it is currently being implemented is brand new and has not yet been optimized in the present context. But even if already perfected, if it turns out to be anywhere near as successful as similar systems I've used in the past (but that generated much smaller returns per trade) I'm apt to be perfectly content with it as is and totally devoid of any motivation to seek out assets that might squeeze out a few extra bucks. (I'm not that sophisticated a trader, and in fact, I'm not sophisticated at all!)

What if AKS steel stock suited your method better than the JPY? Would you trade AKS?

Theoretically yes, but if this were the case, I would probably never know it, and even if I did, the superior performance would have to outweigh all my reasons for no longer trading stocks, such as day trading rules, ridiculously high transaction fees, the hassle involved in shorting equities, limited trading hours. etc.
 

Christian's call of the day IS near the base of my suggested day range and in the bottom half of my two inner (minor) price ranges, but with GBPCHF being so bearish, the rate would have to be twenty-five pips lower, around 1.2741, to really peak my interest.

GBPCHFH1.png
 
Last edited:
Today has been relatively slow and I have absolutely no idea when my targets might be hit, if ever, so I went ahead and locked in the little bit of gains I've realized so far just to have some kind of indication of my trading activity today...

ScreenHunter_2588 Nov. 19 18.01.jpg
 
I went ahead and locked in the little bit of gains I've realized so far
I don't get it ... You use your indicators but it's essentially a discretionary system? So cannot be tested? What's the point then? You may be an amazing trader with or without these indicators.
 
OANDA - MetaTrader.png


The image I posted on Saturday—the setup I intended to use for implementing an offshoot of Numerical Price Prediction which I call Dynamic Probability Trading—was similar to the first chart above, except that it had two fewer envelopes so that it did not look quite as confusing.

The lower chart is the setup I am using presently (after making modifications on Monday). Instead of using three different price range envelopes as I was doing initially (the top image has five envelopes, which is why it is so confusing) I am now using one envelope at three different deviation levels.

The envelope bands are based on a core “true-direction” trend line.

(The original setup made use of two carefully selected moving averages, but I am now [sort of] using four—twice as many.)

The true direction trend line has a light plum-colored center, but is not easily discerned in the above image. More prominent is the lagging “confirmation moving average” with the green core.

For the main feature on this chart, I decided to borrow from Stephen Whiteside and his “Fly Paper Channel” and am calling it the “Magnetic Channel” because it is a zone to which price is drawn again and again.

The upper and lower bands of the Magnetic Channel are thin black lines. When the market is essentially void of liquidity and volatility, an individual can trade quite profitably by entering short positions when the candlesticks make contact with the upper band of the channel and exiting when price crawls down to the lower band, or by entering long positions when the candlesticks make contact with the lower band of the channel and exiting when price climbs up to the upper band.

However, I prefer to wait for price to make contact with the second level of deviation—the dotted bands. This is because price almost never continues far beyond the dotted lines for very long, so if I use the thin black lines, the first level of deviation, as my take-profit target, I am almost guaranteed to have my trade end with success, even if the reversal in the short-term trend is only temporary (which only happens when fundamental factors/influences have taken over control of the market).

The third level of deviation, the purplish and pinkish outer bands, define the most extreme limits to which the candlesticks might be willing to separate themselves from the true-direction trend line before being overpowered by forces encouraging their regression toward the mean and compelled to return to the Magnetic Channel.

The black moving average tracks fluctuations in the short-term trend, so its reversal can signal aggressive position entries and exits. However, it is more prudent to execute trades after a reversal in the crimson-colored moving average (which is actually three closely related moving averages viewed together, which is why I said I am now using four moving averages...sort of).

Basically, as long as the crimson moving averages (the overall short-term trend) continue in a given direction, an individual should remain in that trade (provided he or she is currently holding a position).

(This will also help to prevent traders from falling victim to head fakes by almost totally eliminating false positives.)

Those are essentially all the guidelines I am using at this time. I am hoping they are all I need.
 
Last edited:
ScreenHunter_2592 Nov. 20 21.26.jpg


My performance today was quite abysmal! I expect to be profitable every single day, so this was quite unacceptable! Hopefully, I learned something from the trades that went wrong so that the day will not be a total loss. On the other hand, this 24-hour market cycle is not yet over, so perhaps I might still be able to milk a few gains out of the market before all is said and done.

OANDA - MetaTrader.png


I altered my “Magnet Channel” a tad bit (note the differences between the two setups) so maybe I did learn a little something. But if so, I’ve yet to arrive at clarity, so I obviously still have a ways to go.

UPDATE: Things are already looking better...

ScreenHunter_2593 Nov. 20 22.25.jpg
 
Last edited:
Back
Top