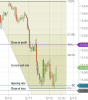
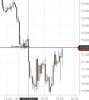
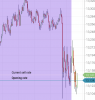
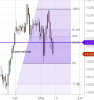
Could you post an image of a chart to show an example of "If price bounces back in the anticipated direction, I personally leave it."
or How would your "if / then" play out on the chart above?
If I get stopped, I don't re-enter.

Could you post an image of a chart to show an example of "If price bounces back in the anticipated direction, I personally leave it."
or How would your "if / then" play out on the chart above?

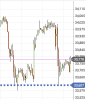
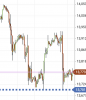
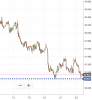
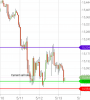
fDAX trade placed earlier today still in progress, double bottom on hourly charts, just under 8/1
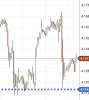
Will NQ follow suit? Entered bit late on this one.
That failed.
Treble bottom in fDAX?