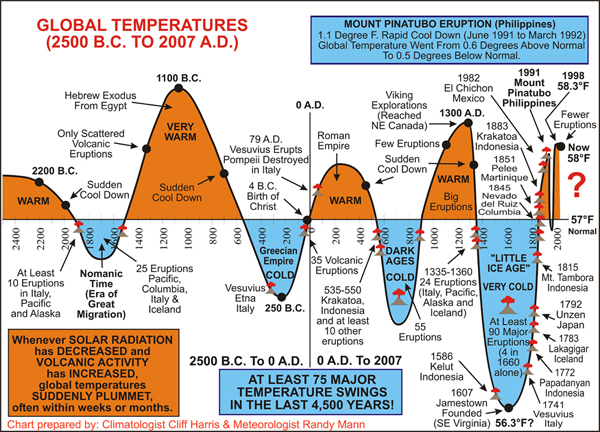
The next long term solar minimum is predicted by many scientist to start in 2015 or 2016 and have a trough approximately in 2035.

Put some error bars on the plots and get back to us. Also look at Salby's temperature chart and post it for us. Do you have a chart of mean global temperature by remote sensing? What does it look like?
The next long term solar minimum is predicted by many scientist to start in 2015 or 2016 and have a trough approximately in 2035.
What caused the little ice age?Nice selection of useless cherry picked selective data and irrelevant charts. Is this supposed to mean something?
What caused the little ice age?
So you don't know?There is thing called google. You should try it sometime skip.

Here is a chart from your favorite website skeptical science.
Huh. That is extremely odd. What a coincidence! There was a medieval warm period during high solar activity. The "little ice age" occurred during the Maunder Minimum, a period of very low solar activity. That is odd.
Yeah, very logical conclusion. It was just a coincidence.Neither of those events were global. They were northern European. Volcanoes caused the Little Ice Age. Solar output variations have very little to do with climate changes. Orbital changes to solar input have a much greater effect.