Breakout and Gap Stocks

CYTR bottom breakout possible, just passes (I think) the min volume for stocks to be posted here that are under $5

BREAKOUT WATCH for possible breakout above 4.28, no resistance in area just above.
Type: True breakout from double resistance.
Target: 4.95, 19% Stop: 3.93, Loss: 5.5%, Profit/Loss ratio: 3.5 : 1 - Excellent

CYTR632014.png


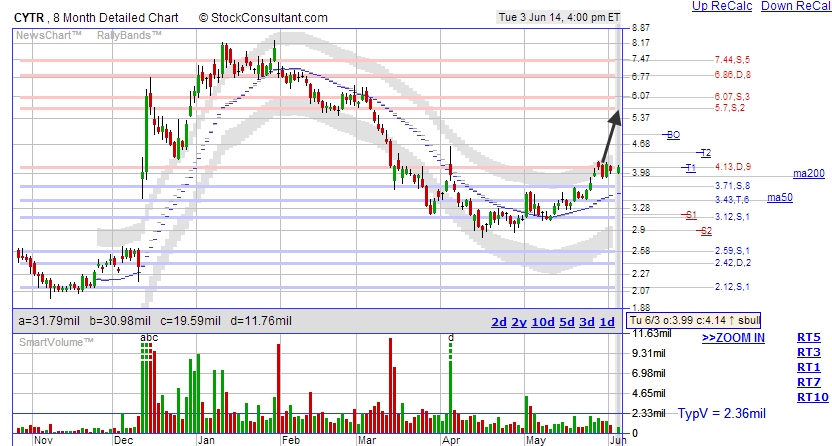
source: <a href="http://www.stockconsultant.com/consultnow/basicplus.cgi?symbol=CYTR"><u>CYTR at StockConsultant</u></a>
 
HPQ mini bull flag with a second breakout attempt

BREAKOUT WATCH for possible breakout above 33.96, no resistance in area just above.
Type: Continuation breakout from single resistance.
Target: 35.82, 6.1% Stop: 33.25, Loss: 1.5%, Profit/Loss ratio: 4.1 : 1 - Excellent

HPQ652014.png


source: <a href="http://www.stockconsultant.com/consultnow/basicplus.cgi?symbol=HPQ"><u>HPQ at StockConsultant</u></a>
 
HPQ this breakout attempt looks like it may follow through, good volume

VOLUME 2.46mil shares, +150% compared to typical volume of 984.8k by 10:05 am ET (15-20 min delayed).
High Volume alert!
Typical daily volume is 12.31mil shares over the past 6 months.

BREAKOUT CONFIRMED breakout above 34.11, no resistance in area just above.
Type: True breakout from double resistance.
Target: 36.08, 4.9% Stop: 33.59, Loss: 2.3%, Profit/Loss ratio: 2.1 : 1 - Fair

HPQ6132014.png


source: <a href="http://www.stockconsultant.com/consultnow/basicplus.cgi?symbol=HPQ"><u>HPQ at StockConsultant</u></a>
 
CREE starting to move, bottom breakout watch

BREAKOUT WATCH for possible breakout above 49.5, no resistance in area just above.
Type: True breakout from double resistance.
Target: 53.68, 11.9% Stop: 46.74, Loss: 2.5%, Profit/Loss ratio: 4.8 : 1 - Excellent

CREE6132014.png


source: <a href="http://www.stockconsultant.com/consultnow/basicplus.cgi?symbol=CREE"><u>CREE at StockConsultant</u></a>
 
MSFT ascending triangle, breakout watch

BREAKOUT WATCH for possible breakout above 41.86, no resistance in area just above.
Type: True breakout from double resistance.
Target: 44, 6% Stop: 40.71, Loss: 1.9%, Profit/Loss ratio: 3.2 : 1 - Excellent

MSFT6162014.png


source: <a href="http://www.stockconsultant.com/consultnow/basicplus.cgi?symbol=MSFT"><u>MSFT at StockConsultant</u></a>
 
MOS another breakout attempt, more volume this time around

VOLUME 3.74mil shares, +32.5% compared to typical daily volume over the past 6 months.
Typical daily volume is 2.82mil shares over the past 6 months.

BREAKOUT WATCH for possible breakout above 50.42, no resistance in area just above.
Type: True breakout from triple+ resistance.
Target: 53.54, 7% Stop: 48.86, Loss: 2.4%, Profit/Loss ratio: 2.9 : 1 - Good

MOS6192014.png


source: <a href="http://www.stockconsultant.com/consultnow/basicplus.cgi?symbol=MOS"><u>MOS at StockConsultant</u></a>
 
EGY bottom breakout watch

VOLUME 5.35mil shares, +781% compared to typical daily volume over the past 6 months.
High Volume alert!
Typical daily volume is 607.2k shares over the past 6 months.

BREAKOUT WATCH for possible breakout above 7.31, no resistance in area just above.
Type: True breakout from triple resistance.
Target: 7.93, 12% Stop: 6.85, Loss: 3.2%, Profit/Loss ratio: 3.8 : 1 - Excellent

EGY6232014.png


source: <a href="http://www.stockconsultant.com/consultnow/basicplus.cgi?symbol=EGY"><u>EGY at StockConsultant</u></a>
 
CRUS breakout attempt, ascending triangle

BREAKOUT WATCH for possible breakout above 23.78, no resistance in area just above.
Type: True breakout from double resistance.
Target: 25.24, 6.6% Stop: 23.16, Loss: 2.2%, Profit/Loss ratio: 3 : 1 - Good

CRUS6232014.png


source: <a href="http://www.stockconsultant.com/consultnow/basicplus.cgi?symbol=CRUS"><u>CRUS at StockConsultant</u></a>
 
Back
Top