I'll have to go back and add them up, maybe a weekend excerise
You are using an out of date browser. It may not display this or other websites correctly.
You should upgrade or use an alternative browser.
You should upgrade or use an alternative browser.
Breakout and Gap Stocks
- Thread starter Stocks4life
- Start date
RAD 3rd try at a breakout from this fat top area, good volume today
VOLUME 9mil shares, +59% compared to typical volume of 5.66mil by 10:45 am ET (15-20 min delayed).
Typical daily volume is 23.59mil shares over the past 6 months.
BREAKOUT WATCH for possible breakout above 7.99, no resistance in area just above.
Type: True breakout from double resistance.
Target: 8.83, 11.1% Stop: 7.69, Loss: 3.3%, Profit/Loss ratio: 3.4 : 1 - Excellent
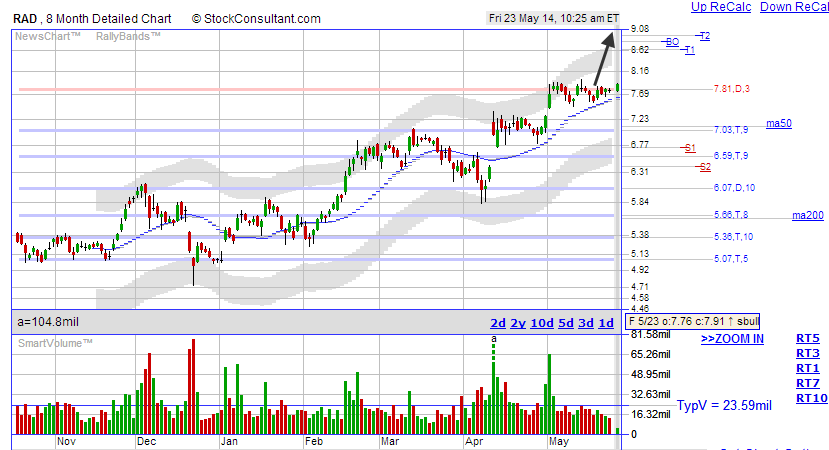
source: <a href="http://www.stockconsultant.com/consultnow/basicplus.cgi?symbol=RAD"><u>RAD at StockConsultant</u></a>
VOLUME 9mil shares, +59% compared to typical volume of 5.66mil by 10:45 am ET (15-20 min delayed).
Typical daily volume is 23.59mil shares over the past 6 months.
BREAKOUT WATCH for possible breakout above 7.99, no resistance in area just above.
Type: True breakout from double resistance.
Target: 8.83, 11.1% Stop: 7.69, Loss: 3.3%, Profit/Loss ratio: 3.4 : 1 - Excellent
source: <a href="http://www.stockconsultant.com/consultnow/basicplus.cgi?symbol=RAD"><u>RAD at StockConsultant</u></a>
What's the strategy? I don't see any trades or follow up on the posts.
Do you track the performance of these trades somewhere?
I'll have to go back and add them up, maybe a weekend excerise
Well then the answer is No.
You do not track the performance. Otherwise it's just a simple step of outputting any trading records or spreadsheet data you have. Should only take a few seconds, not the weekend.
")
GIMO possible bottom breakout
BREAKOUT WATCH for possible breakout above 17.99, no resistance in area just above.
Type: True breakout from triple resistance.
Target: 21.27, 20.9% Stop: 16.66, Loss: 5.3%, Profit/Loss ratio: 3.9 : 1 - Excellent

source: <a href="http://www.stockconsultant.com/consultnow/basicplus.cgi?symbol=GIMO"><u>GIMO at StockConsultant</u></a>
GIMO attempting to move higher today
Well then the answer is No.
You do not track the performance. Otherwise it's just a simple step of outputting any trading records or spreadsheet data you have. Should only take a few seconds, not the weekend.
FX this is just a sample (1/3rd to 1/5th) of what I like, since it takes a while to prepare and post the data and charts (I'm too busy trading stocks/options and futures), plus these are just trade ideas, anyways always do you own DD and if you like the chart (experienced enough to understand it and it fits your trading style) take the trade and possible profit. For people who take 10-15 minute trades (most people on StockTwits) these ideas would probably not work.
I managed to collect some stats for the first 10 pages on this thread so far about 33 hit targets, 2 failed, and 8 failed to trigger (breakout), I'll try to get the rest done later, it is getting late.
HA one of the many strong airline stocks breaking to new highs
VOLUME 521.7k shares, +14.3% compared to typical volume of 456.4k by 12:25 pm ET (15-20 min delayed).
Typical daily volume is 1.04mil shares over the past 6 months.
BREAKOUT WATCH for possible breakout above 15.34, no resistance in area just above.
Type: Continuation breakout from single resistance.
Target: 16.75, 10.1% Stop: 14.65, Loss: 3.7%, Profit/Loss ratio: 2.7 : 1 - Good
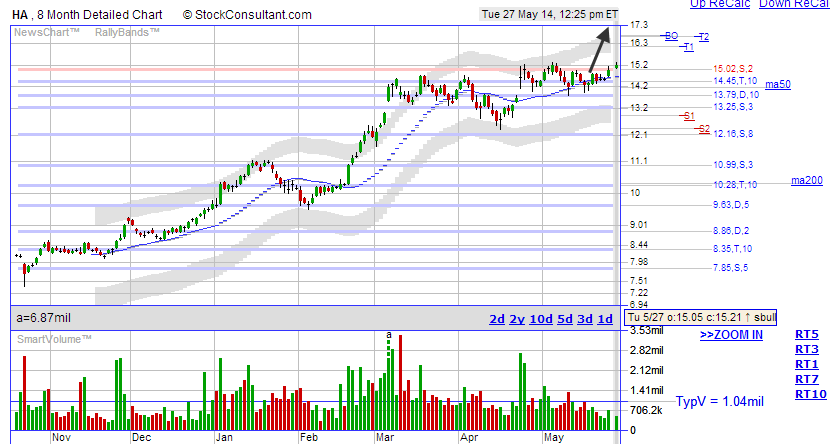
source: <a href="http://www.stockconsultant.com/consultnow/basicplus.cgi?symbol=HA"><u>HA at StockConsultant</u></a>
VOLUME 521.7k shares, +14.3% compared to typical volume of 456.4k by 12:25 pm ET (15-20 min delayed).
Typical daily volume is 1.04mil shares over the past 6 months.
BREAKOUT WATCH for possible breakout above 15.34, no resistance in area just above.
Type: Continuation breakout from single resistance.
Target: 16.75, 10.1% Stop: 14.65, Loss: 3.7%, Profit/Loss ratio: 2.7 : 1 - Good
source: <a href="http://www.stockconsultant.com/consultnow/basicplus.cgi?symbol=HA"><u>HA at StockConsultant</u></a>
MNTA bottom breakout possible good resistance gap
BREAKOUT WATCH for possible breakout above 12.17, no resistance in area just above.
Type: True breakout from triple resistance.
Target: 13.28, 9.6% Stop: 11.74, Loss: 3.1%, Profit/Loss ratio: 3.1 : 1 - Excellent
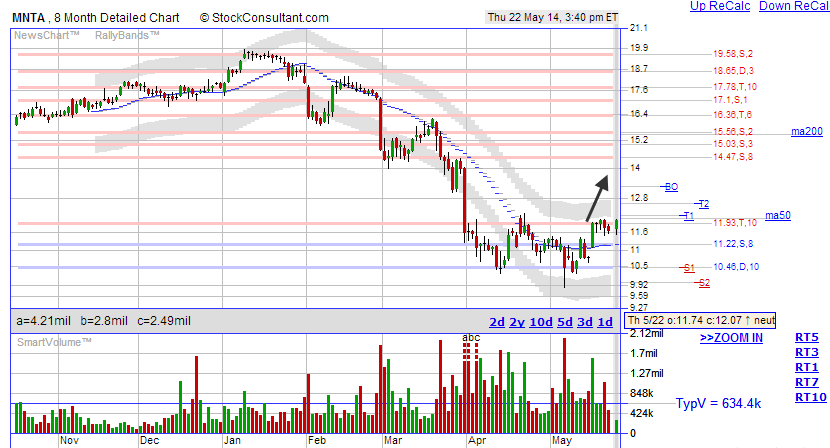
source: <a href="http://www.stockconsultant.com/consultnow/basicplus.cgi?symbol=MNTA"><u>MNTA at StockConsultant</u></a>
moving into the resistance gap, nice day
MACK second leg starting, great volume
VOLUME 1.9mil shares, +122% compared to typical volume of 854.1k by 12:55 pm ET (15-20 min delayed).
High Volume alert!
Typical daily volume is 1.74mil shares over the past 6 months.
BREAKOUT CONFIRMED breakout above 7.08, no resistance in area just above.
Type: True breakout from double resistance.
Target: 8.4, 15.5% Stop: 6.78, Loss: 6.7%, Profit/Loss ratio: 2.3 : 1 - Good
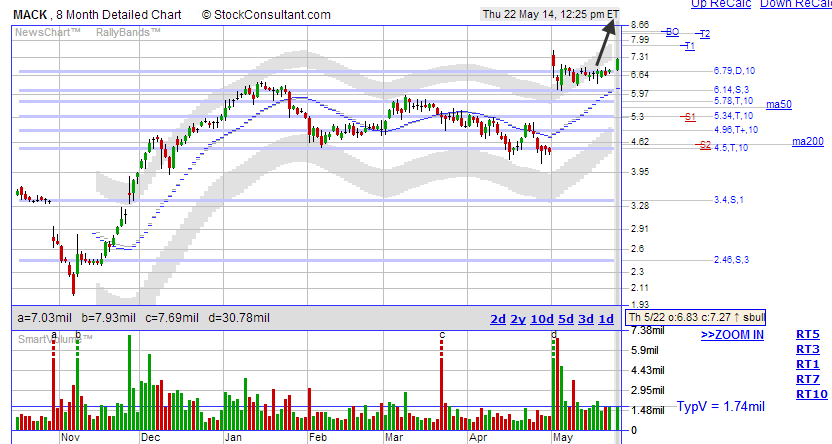
source: <a href="http://www.stockconsultant.com/consultnow/basicplus.cgi?symbol=MACK"><u>MACK at StockConsultant</u></a>
nice follow through on the breakout
FST second attempt on a bottom breakout into the price gap
VOLUME 1.57mil shares, +77.3% compared to typical volume of 883.7k by 10:45 am ET (15-20 min delayed).
High Volume alert!
Typical daily volume is 3.68mil shares over the past 6 months.
BREAKOUT WATCH for possible breakout above 2.38, no resistance in area just above.
Type: Continuation breakout from single resistance.
Target: 2.77, 17.9% Stop: 2.22, Loss: 5.5%, Profit/Loss ratio: 3.2 : 1 - Excellent
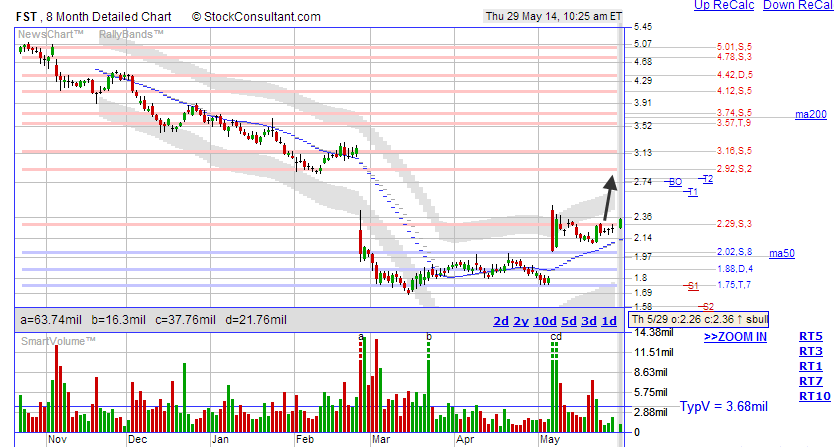
source: <a href="http://www.stockconsultant.com/consultnow/basicplus.cgi?symbol=FST"><u>FST at StockConsultant</u></a>
VOLUME 1.57mil shares, +77.3% compared to typical volume of 883.7k by 10:45 am ET (15-20 min delayed).
High Volume alert!
Typical daily volume is 3.68mil shares over the past 6 months.
BREAKOUT WATCH for possible breakout above 2.38, no resistance in area just above.
Type: Continuation breakout from single resistance.
Target: 2.77, 17.9% Stop: 2.22, Loss: 5.5%, Profit/Loss ratio: 3.2 : 1 - Excellent
source: <a href="http://www.stockconsultant.com/consultnow/basicplus.cgi?symbol=FST"><u>FST at StockConsultant</u></a>