Breakout and Gap Stocks

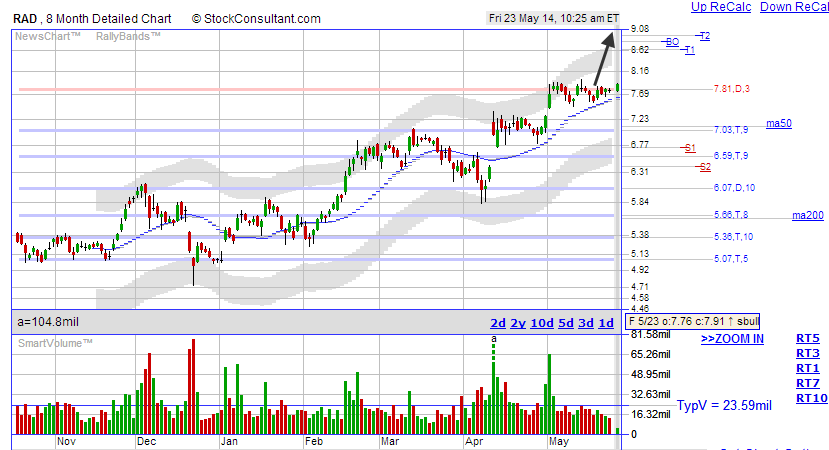
RAD 3rd try at a breakout from this fat top area, good volume today

VOLUME 9mil shares, +59% compared to typical volume of 5.66mil by 10:45 am ET (15-20 min delayed).
Typical daily volume is 23.59mil shares over the past 6 months.

BREAKOUT WATCH for possible breakout above 7.99, no resistance in area just above.
Type: True breakout from double resistance.
Target: 8.83, 11.1% Stop: 7.69, Loss: 3.3%, Profit/Loss ratio: 3.4 : 1 - Excellent

RAD5232014.png


source: <a href="http://www.stockconsultant.com/consultnow/basicplus.cgi?symbol=RAD"><u>RAD at StockConsultant</u></a>

Do you analysis any London stock or only US?
 
BBY a little flag here, may finally breakout into the price gap

BREAKOUT WATCH for possible breakout above 27.86, no resistance in area just above.
Type: True breakout from triple resistance.
Target: 30.65, 12.4% Stop: 26.43, Loss: 3.1%, Profit/Loss ratio: 4 : 1 - Excellent

BBY5292014.png


source: <a href="http://www.stockconsultant.com/consultnow/basicplus.cgi?symbol=BBY"><u>BBY at StockConsultant</u></a>
 
HA one of the many strong airline stocks breaking to new highs

VOLUME 521.7k shares, +14.3% compared to typical volume of 456.4k by 12:25 pm ET (15-20 min delayed).
Typical daily volume is 1.04mil shares over the past 6 months.

BREAKOUT WATCH for possible breakout above 15.34, no resistance in area just above.
Type: Continuation breakout from single resistance.
Target: 16.75, 10.1% Stop: 14.65, Loss: 3.7%, Profit/Loss ratio: 2.7 : 1 - Good

HA5272014.png


source: <a href="http://www.stockconsultant.com/consultnow/basicplus.cgi?symbol=HA"><u>HA at StockConsultant</u></a>

Good follow through today on the breakout
 
BBY a little flag here, may finally breakout into the price gap

BREAKOUT WATCH for possible breakout above 27.86, no resistance in area just above.
Type: True breakout from triple resistance.
Target: 30.65, 12.4% Stop: 26.43, Loss: 3.1%, Profit/Loss ratio: 4 : 1 - Excellent

BBY5292014.png


source: <a href="http://www.stockconsultant.com/consultnow/basicplus.cgi?symbol=BBY"><u>BBY at StockConsultant</u></a>

nice move this morning with a confirmed breakout
 
FST second attempt on a bottom breakout into the price gap

VOLUME 1.57mil shares, +77.3% compared to typical volume of 883.7k by 10:45 am ET (15-20 min delayed).
High Volume alert!
Typical daily volume is 3.68mil shares over the past 6 months.

BREAKOUT WATCH for possible breakout above 2.38, no resistance in area just above.
Type: Continuation breakout from single resistance.
Target: 2.77, 17.9% Stop: 2.22, Loss: 5.5%, Profit/Loss ratio: 3.2 : 1 - Excellent

FST5292014.png


source: <a href="http://www.stockconsultant.com/consultnow/basicplus.cgi?symbol=FST"><u>FST at StockConsultant</u></a>

strong day for FST entering the price gap
 
MOS pressure building, breakout watch

BREAKOUT WATCH for possible breakout above 50.39, no resistance in area just above.
Type: True breakout from triple+ resistance.
Target: 53.57, 7.2% Stop: 49.13, Loss: 1.7%, Profit/Loss ratio: 4.2 : 1 - Excellent

MOS622014.png


source: <a href="http://www.stockconsultant.com/consultnow/basicplus.cgi?symbol=MOS"><u>MOS at StockConsultant</u></a>
 
I haven't read through every thread here, but:
1) how do you define a breakout?
2) when and how do you admit your wrong on a beakout trade gone bad?
 
a breakout is the rise above (or breakdown below) a well defined resistance area, single, double,triple, triple+, usually the StockConsultant defines the upper/lower extent of this area.

you are usually wrong when it falls out of the bottom of the resistance area with strong volume, but it could skirt along the resistance area for some time with multiple tries before breaking out.

i like to use options at times to limit risk and will usually give up to a month for the trade to develop or fail

of course this is all just my opinion.
 
Back
Top