the theory is that the market will tend to move towards and reverse at areas of high liquidity
It seems to me like it there were also levels at 5281.25, and 5280, but those easily broke.
This is what I was going to comment earlier, but was curious to see if anyone else actually had something good to say. These areas sometimes are magnets and price bounces off them, and sometimes price just trades right through them. I still watch this because my platform gives me this same indicator, but I cannot make any concrete decisions with this data. Its a coin toss as to whether to take a trade hoping the levels hold or not.
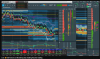
Plus, what your chart shows is somewhat misleading because it adjusts the colors based on the amount of resting orders at the time. The red lines during slow periods might only be 100 contracts at a level, but other times, it might represent 1000 contracts. It makes it looks like these levels are far more important than they are. I specifically see in the first chart a level that is red at price 5274 with 239 contracts. But when you watch volume, 239 contracts can trade in only seconds. So then I have to question how important is it to show 239 contracts waiting at a level when this amount of volume can be absorbed at any time without showing any size. So if you add up all the volume that is shown in resting bids, but then look at how much volume actually transacted, you see a huge difference.
Its not like in real estate where all of a sudden, if 100 extra homes in your area are on the market, this is a big deal because it will be difficult to absorb 100 homes for purchase when there were only 50 homes initially available. I think the RE industry uses some metric which tracks how many months of inventory there are. If 20 homes sell a month, an initial volume of 50 listings would be 2.5 months of inventory. But when another 100 homes come on the market, that is an additional 5 months of inventory, which is a big deal. With the ES, seeing a huge bid or offer of 200 contracts might be 3 seconds of inventory... LOL
As someone said earlier, iceberg orders and such are way more interesting because in T&S, you can really see where the heavy trading was, but the size that is shown in the resting orders via level 2 is minuscule. And even if it was significant, you still have to decide if you will fade it or not. During trend days, even single "wall" of heavy Ask prices is taken out on the way up, and then it just keeps climbing. So if I have to question if seeing a heavy bid or ask means I should fade the move or not, and chances are 50/50, its not any more useful than simply wondering is a round number like 5200 will hold, or if the previous day high or low should be faded, etc.


")