I think it's because they use Prob of OTM aka 84% for the standard deviation on each side. They are looking for a Situation were the Put Scew is reversed ("
Falling Put Curve and Rising Call Curve").
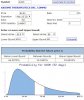
Normal case:
Ppl fear a downward move more and are buying more puts, the Probability distribution (and thus the OTM Probability per Strike) is derived from which Strikes people buy the most/least. A 30 Delta on the Put Side will have a lower OTM Probability than a OTM Probability on the Call Side on the exact same delta (see Picture). Usually you would approximate via a Delta of 16 (16%ITM Prob=84%OTM Prob=1 STDV) but since the probability distribution is scewed to the put side the approximation doesn't work like 16 delta=16%ITM/84% OTM Probability. The Implied Volatility is calculated from the Option Price as well, the higher the price the higher the IV the flatter the Implied Distribution thus Delta doesn't work as a 1:1 approximation of the ITM Probability.
You will have to go to a e.g. Delta of 8 on the Put Side and Delta of 32 on the Call Side (both of them will have to move to the left on the Probability Distribution to capture the 84%) to get a OTM Probability of 84% (or ITM Prob of 16%) on both Sides. You are Selling ATM and Buying the Wings in an Iron Butterfly so:
ATM Call & Put = Put ATM Delta -50 Call ATM Delta-50 =0
Wings= Delta -8 Put Side Delta +32 Call Side
In a normal Put Scew Situation you would be Long Delta
The Authors want that you look for a steep call Curve (and flat Put Curve), so the exact Opposite of the case above. It's the Put Scew in Reverse. You are Buying the Wings at -32 Put Side Delta and +8 Call Side Delta (deltas move to the right to caputure OTM Probability). This is why they want you to buy an extra Call/Shares to isolate Volatility
Imagine the Image Attached (Normal Case with Put Scew) BUT in reverse (Call Side Steep)
I had a very similar problem yesterday:
https://www.elitetrader.com/et/threads/abnormal-skew-in-delta-prob-of-otm.343276/