If I get stopped out, that means it was not an ideal entry, even if it goes my way afterwards, so it literally pays to have a tight stop that works in your favor.
I completely agree (if it goes my way afterwards, I can sometimes re-enter, anyway).
If I get stopped out, that means it was not an ideal entry, even if it goes my way afterwards, so it literally pays to have a tight stop that works in your favor.
I completely agree (if it goes my way afterwards, I can sometimes re-enter, anyway).

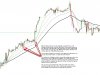
I like to use the direction of one simple moving average and its alignment with three others to help me identify reversals in the intraday trend (yellow arrows). Also, the interplay between the candlesticks and the (slopes of the) two longer-term moving averages helps me identify good entry levels when exchange rates experience pullbacks from their dominant trajectories (orange triangles).
View attachment 183794

The MotiveWave Strategy Edition is $595 for a lifetime license. It has full backtesting capabilities. We have 15+ Moving Average studies built-in (see the list under the Moving Averages section: https://www.motivewave.com/studies/studies.htm). There are a lot of settings/customizations you can do on each of them without having to custom program them yourself.Thanks SimpleMeLike. Do you know of any good (cheap also good, free even better) back-testing software or what not? Thanks!
Does anyone use these? Anyone know whether any of them produce better results than just a buy and hold? Even if normally buy and hold is better, I would bet moving average systems would produce much lower drawdowns, particularly when the market is sky high like it is now. Seems like with a moving average, once the price starts to dip, you cover, and don't uncover again until maybe many percentage points more to the downside, thus hopefully missing the next bear market in large part.
I'm trying to read up on these, but most don't seem to be all that great off hand. Anyone have any thoughts?
Thanks!
Thats a Good one expiated, I do something similar in choppy sideways markets. Except I use the lowest Moving average against Price, so one thing I notice is that Price will only go so far away from the lowest average before it reverses. I determined the average price moves against its slowest tracking average by back testing. This is great for Fading highs or lows in chop city.
What I ended up with was a system predicated on the following three suppositions:
- The best “atmospheric barometer” for predicting the direction in which an exchange rate might ultimately be headed is what’s known as a moving average, with a handful of key moving averages evidencing superior accuracy in this role.
2. Generally speaking, exchange rates distance themselves only so far from these moving averages before they are compelled to return to more typical deviation levels. I refer to these “maximum degrees of separation” as “statistical support/resistance levels,” which I assume are controlled by market makers and/or automated trading algorithms.

3. By correctly interpreting the relationships between the above mentioned moving averages and their corresponding statistical support/resistance levels, it is possible to forecast when and where price is likely to reverse direction; enabling traders to enter long and short positions (to buy and sell, respectively) ONLY when the odds are very much in their favor.