DO YOU REALLY THINK YOU CAN COME ON THIS FORUM AND MAKE FOOLS OUT OF THE SMARTEST PERSONS
You are using an out of date browser. It may not display this or other websites correctly.
You should upgrade or use an alternative browser.
You should upgrade or use an alternative browser.
A message to some day traders.
- Thread starter Amahrix
- Start date
I ALREADY ANSWERED THIS; READ THE POST. IT SAYS AT THE TOP THAT THIS IS FROM THE FOLLOWING LINK "https://www.priceactionlab.com/Blog/2015/09/jim-simons-trend-following-broken/"this book WHO THE FU*K IS DELUSIONAL
I REST MY CASE
IT'S A COPY AND PASTE FROM A DIFFERENT WEBSITE, DIFFERENT AUTHOR
CLICK "MORE.."
From: https://www.priceactionlab.com/Blog/2015/09/jim-simons-trend-following-broken/
(Michael Harris, the author, is very nice and generous about the subject; I am not).
Jim Simons has expressed his views about trend-following during a TED interview.
Revised February 21, 2019.
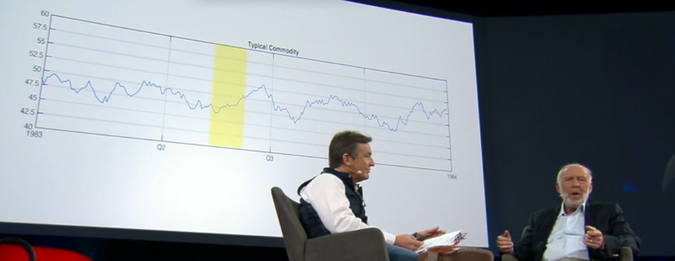
During a Ted interview, Jim Simons showed a commodity chart and talked about how in the past traders were able to use 20 days of prices (and their average) as a predictor of future prices (about 13:00 minutes from start).
Jim Simons called that trend-following and argued that it no longer works. But some academic papers base the efficacy of trend-following on t-statistics derived from long-term data series and very slow moving averages .
In my book, Fooled by Technical Analysis, I discuss the perils of using the t-statistic and hypothesis testing in trading system development. Using a t-statistic is really a rudimentary mistake. If you have 100 years of data, even a horrible Sharpe ratio in the order of 0.30 will generate a high t-statistic, as follows
t-statistic = Sharpe ratio × SQRT(number of years)
For Sharpe ratio of 0.30 in the course of 100 years, the t-statistic is 3.00. Does this mean that a trading system is significant? What about if the drawdown is -50%? Do fund managers like a -50% drawdown? Some close shop after a -10% drawdown.
Thus, the first problem is that long-term backtests can be misleading. Especially problematic are backtests on a basket of commodities because of hindsight bias.
Then, another problem is that when one tests many choices of parameters, data-mining bias is introduced due to multiple comparisons. Actually, the whole procedure usually followed is based on multiple comparisons of different moving average crossover values and testing periods. In this case, the t-statistic must be adjusted and significance is lost, as Harvey and Liu showed in their paper.
More importantly…
The argument is not whether someone today can or cannot find a trend-following system that will work. This is possible and such systems may exist. The argument is about changing market conditions that render short-term trend following unprofitable.
I did not test a basket of commodities because that can introduce a lot of hindsight bias. The more instruments there are, the higher the bias. I just used the most popular index, the S&P 500, to show that Jim Simons is right and fast trend-following stopped working in the early 1990s. This is also confirmed by my Momersion indicator.
Longer-term trend-following appears to work only for those that underestimate risks. Below is the performance of a 50-200 moving average crossover in SPY since inception:
The maximum drawdown is -35%. This system has a t-statistic of about 2.06, which is borderline significant depending on assumptions. The question is:
Would anyone trust life savings or client funds on this system or on a similar system? I would not. I think Jim Simons would not either and this is why he claimed that trend-following is broken.


Last edited:
GO LOOK AT MY LAST POST IMBECILEDO YOU REALLY THINK YOU CAN COME ON THIS FORUM AND MAKE FOOLS OUT OF THE SMARTEST PERSONS
DO YOU SEE IT NOW?!
I DON'T HAVE NO F*CKING BOOK.
Last edited:
@padutrader YOU SEE?!
the why did you say thisI DON'T HAVE NO F*CKING BOOK.
In my book, Fooled by Technical Analysis, I discuss the perils of using the t-statistic and hypothesis testing in trading system development. Using a t-statistic is really a rudimentary mistake. If you have 100 years of data, even a horrible Sharpe ratio in the order of 0.30 will generate a high t-statistic, as follows
the why did you say this
Somebody help me here...
Go to the post where you saw that. You'll notice that it is not me. It is a copy and paste and I made that very clear from the start where I linked the article and then copied and pasted it below.
Those are not my words.
https://www.priceactionlab.com/Blog/2015/09/jim-simons-trend-following-broken/
I put a disclaimer AT THE VERY F*CKING BEGINNING OF THE POST.
Last edited:
Bro, are you talking to ME?!My goodness !!!
What is your main occupation? Trading or writing?
If you trade with extreme negative emotions, you are going to make wrong silly decision and
end up with huge trading losses.
OP I doubt u ever traded in your life.
if u did then u would know "predict" is the wrong word to represent trading.
The right word is "bet".

The classic difference is the person trading assume that he can be wrong from the get go. Each trading entry defined with SL/Risk without that u cannot trade.
It also an acknowledgement u are trading the unknown Or in your terminology randomness.
You need not be GOD and all knowing info to trade the unknown and make money.People have been trading the unknown since ages thats why it is called taking risk. if somebody is GOD and have complete INFO then they will acquire entire planet money in a few trades.
there trade will be riskless ..technically it can't be called trading anymore.
If a person long say @ $100 with SL $90 and some black swan happens and the instrument goes to 0. guess what the person took $10 loss(assuming it is liquid enough and no overnight trading) and not more which is what he has already planned and defined as part his system.
if u did then u would know "predict" is the wrong word to represent trading.
The right word is "bet".
The classic difference is the person trading assume that he can be wrong from the get go. Each trading entry defined with SL/Risk without that u cannot trade.
It also an acknowledgement u are trading the unknown Or in your terminology randomness.
You need not be GOD and all knowing info to trade the unknown and make money.People have been trading the unknown since ages thats why it is called taking risk. if somebody is GOD and have complete INFO then they will acquire entire planet money in a few trades.
there trade will be riskless ..technically it can't be called trading anymore.
If a person long say @ $100 with SL $90 and some black swan happens and the instrument goes to 0. guess what the person took $10 loss(assuming it is liquid enough and no overnight trading) and not more which is what he has already planned and defined as part his system.