I honestly don't understand the perceived difference between trading stocks and futures. If anything, futures have preferential tax treatment in the US, huge liquidity, just as easy to go short as go long, but granted, you can't get zero commissions.
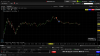
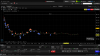
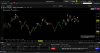
But aside from some pros and cons of each, is there really a huge difference with how they move? I went through your charts and am showing them down below in exactly the same format. Some are from both winning and losing days in MRNA, plus your NG trading, plus two ES charts thrown in for fun. If we take away the price scale, is it obvious which chart is a stock vs. a future? Is it that much easier to trade one chart vs. another?
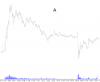
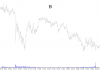


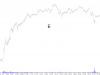
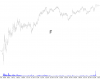
The symbol and date is in the file name, but I think many of us will agree that looking at it this way, there isn't one chart that stands out as being easy to trade. A, B and C all have a very similar pattern, but B is actually an ES chart while A and C are MRNA.
If we consider D, E and F, we might see the spike up on D to indicate this was the NG chart, but its hard otherwise to distinguish them as all three are essentially an all day grind higher. D is the NG chart, E is an ES chart and F is MRNA.
Now obviously if you're making money trading MRNA but not trading NG, stick with where the money is. Likewise, if watching something gives you an edge to trade NG, then I understand why you would choose that market. But if you line up 100 charts like this, can someone conclusively say which is a stock and which is a future? And more importantly, is one easier to trade over another?
But aside from some pros and cons of each, is there really a huge difference with how they move? I went through your charts and am showing them down below in exactly the same format. Some are from both winning and losing days in MRNA, plus your NG trading, plus two ES charts thrown in for fun. If we take away the price scale, is it obvious which chart is a stock vs. a future? Is it that much easier to trade one chart vs. another?
The symbol and date is in the file name, but I think many of us will agree that looking at it this way, there isn't one chart that stands out as being easy to trade. A, B and C all have a very similar pattern, but B is actually an ES chart while A and C are MRNA.
If we consider D, E and F, we might see the spike up on D to indicate this was the NG chart, but its hard otherwise to distinguish them as all three are essentially an all day grind higher. D is the NG chart, E is an ES chart and F is MRNA.
Now obviously if you're making money trading MRNA but not trading NG, stick with where the money is. Likewise, if watching something gives you an edge to trade NG, then I understand why you would choose that market. But if you line up 100 charts like this, can someone conclusively say which is a stock and which is a future? And more importantly, is one easier to trade over another?