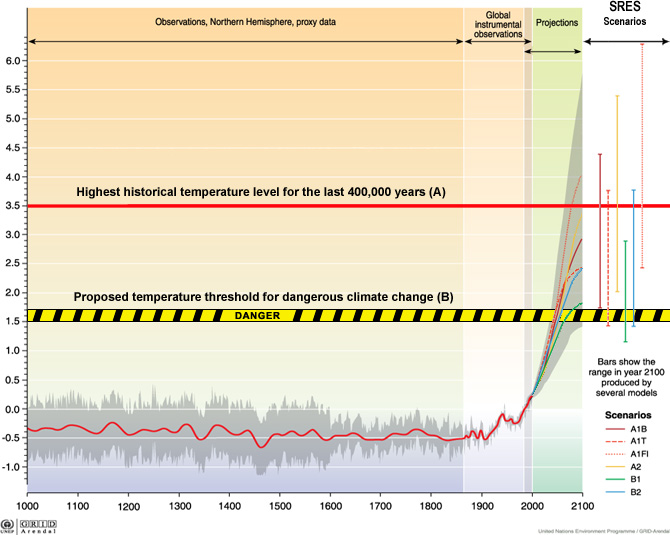
mann you are a troll with zero integrity fraudcurrents.
I just showed you misrepresented the land ocean temps and land temps...
and now I have to show you to have integrity again?
1. you are leaving out multiple recent studies which show the world was warmer during midieval times...
2. plus... you are looking at mikes nature trick...
http://climateaudit.org/2009/11/20/mike’s-nature-trick/
From: Phil Jones
To: ray bradley ,
mann@xxxxx.xxx,
mhughes@xxxx.xxx
Subject: Diagram for WMO Statement
Date: Tue, 16 Nov 1999 13:31:15 +0000
Cc:
k.briffa@xxx.xx.xx,
t.osborn@xxxx.xxx
Dear Ray, Mike and Malcolm,
Once Tim’s got a diagram here we’ll send that either later today or
first thing tomorrow.
I’ve just completed Mike’s Nature trick of adding in the real temps
to each series for the last 20 years (ie from 1981 onwards) amd from
1961 for Keith’s to hide the decline. Mike’s series got the annual
land and marine values while the other two got April-Sept for NH land
N of 20N. The latter two are real for 1999, while the estimate for 1999
for NH combined is +0.44C wrt 61-90. The Global estimate for 1999 with
data through Oct is +0.35C cf. 0.57 for 1998.
Thanks for the comments, Ray.
Cheers
Phil
Prof. Phil Jones
Climatic Research Unit Telephone +44 (0) xxxxx
School of Environmental Sciences Fax +44 (0) xxxx
University of East Anglia
Norwich Email
p.jones@xxxx.xxx
NR4 7TJ
UK
The e-mail is about
WMO statement on the status of the global climate in 1999 -report, or more specifically, about its cover image.
{Note: also see
IPCC and the Trick,
Keith’s Science Trick, Mike’s Nature Trick and Phil’s Combo
[
Update November 24: Jones' confession
Nov 24 Update on the issue has the following graph, which is the WMO diagram without "Mike's Nature trick".
I think the graph speaks for itself, see especially "Keith's series" (green).] [
Update Steve May 5, 2010 - Jones' graphic shown here appears to be identical to the version shown in Briffa et al JGR 2001].
Back in December 2004
John Finn asked about “the divergence” in
Myth vs. Fact Regarding the “Hockey Stick” -thread of RealClimate.org.
Whatever the reason for the divergence, it would seem to suggest that the practice of grafting the thermometer record onto a proxy temperature record – as I believe was done in the case of the ‘hockey stick’ – is dubious to say the least.
mike’s response speaks for itself.
No researchers in this field have ever, to our knowledge, “grafted the thermometer record onto” any reconstrution. It is somewhat disappointing to find this specious claim (which we usually find originating from industry-funded climate disinformation websites) appearing in this forum.
But there is an interesting twist here: grafting the thermometer onto a reconstruction is not actually the original “Mike’s Nature trick”! Mann did not
fully graft the thermometer on a reconstruction, but he stopped the smoothed series in their end years. The trick is more sophisticated, and was uncovered by UC over
here.
When smoothing these time series, the Team had a problem: actual reconstructions “diverge” from the instrumental series in the last part of 20th century. For instance, in the original hockey stick (ending 1980) the last 30-40 years of data points slightly downwards. In order to smooth those time series one needs to “pad” the series beyond the end time, and no matter what method one uses, this leads to a smoothed graph pointing downwards in the end whereas the smoothed instrumental series is pointing upwards — a divergence. So Mann’s solution was to use the instrumental record for padding, which changes the smoothed series to point upwards as clearly seen in UC’s figure (violet original, green without “Mike’s Nature trick”).
I dare question it because you are a ideologically depraved piece of shit liar. That's why.
This work by Mann et al is the best current look back in time.
.
Figure 6: Composite Northern Hemisphere land and land plus ocean temperaturereconstructions and estimated 95% confidence intervals. Shown for comparison are published Northern Hemisphere reconstructions (Mann 2008).