see this is the take way above the last paragraph....
The point of all this is that temperature is driving CO2, not the other way around. - See more at:
http://notrickszone.com/2013/10/08/...-co2-and-not-vice-versa/#sthash.gBOX3Ftl.dpuf
http://notrickszone.com/2013/10/08/...emperature-is-driving-co2-and-not-vice-versa/
Studies of the CO2 emission and absorption have shown that the tropical seas emit CO2 and the cold, sinking, north Pacific and Atlantic absorb CO2. This has even been mapped. This is all due to the variation in CO2 solubility with temperature.
Caryl_5 (see the image at the site)
Figure 5: Source link for the above figure and caption.
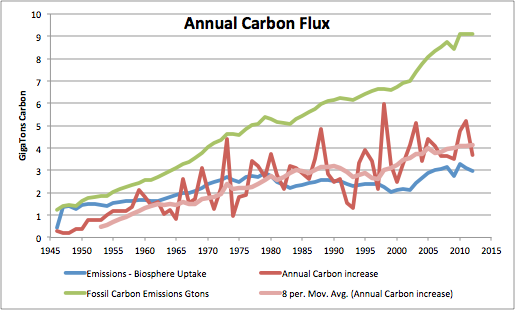
The sea surface CO2 partial pressure is always very close to the CO2 partial pressure in the atmosphere above it. The sea surface is always in equilibrium with the atmosphere. This means that as we add CO2 in burning fossil fuels, some is taken up by the land biosphere. The remainder CO2 is dissolved and added to the CO2 reservoir in the surface waters. The mixed layer in the ocean is the top 20 to 200 meters, depending on the amount of wave and current mixing. That mixed layer is about 1/50th of the ocean volume. It contains roughly the same amount of CO2 as the atmosphere, as dissolved inorganic carbon (DIC). The difference, whether the ocean is emitting CO2 or absorbing it, is driven by temperature. As can be seen in the above figures, an El Niño can drive 2 or 3 Gigatons of carbon into the atmosphere and a La Niña can take it right out again. The rise in CO2 is due to rising SST, not fossil fuel burning.
Caryl_6
Figure 6 is a plot of figure 4b and the biosphere increase from the previous biosphere article here, subtracted from the annual carbon increase.
The above is a residual. But the curve looks familiar.
Caryl_7
Figure 7 is Figure 6 with the average annual AMO index inverted.
Note on the map, figure 5, that the warm tropical seas emit CO2, and the cool northern seas absorb CO2. The AMO index is a temperature index for the North Atlantic. It is derived by subtracting the global SST from 60°N to 60°S from the total SST, or alternatively, the Atlantic temperate and tropical SST from the whole north Atlantic. This means that as the tropical ocean warms more than the average global ocean, this drives the AMO index negative. This shifts the CO2 solubility (figure 2) downward and to the right. That peak in the 1970âs occurs because the tropical oceans were warmer than the average during that period, emitting more CO2. Since that time, the difference has gone the other way, the biosphere is taking up increasing amounts of CO2, lowering the amount of CO2 left in the atmosphere. You can also see a one year lag between AMO and the carbon flux. This is because the AMO lags the tropical Pacific by about a year.
The point of all this is that temperature is driving CO2, not the other way around.
We have good measurements of atmospheric CO2 only since 1958. Before that time our measurements were at the mercy of whatever ice does to captured CO2. We have good global measurements of temperature only from 1979, the beginning of the satellite era. This means that all of our measurement periods are shorter than the natural cycles. We have hints only from surface and ship measurements that go back 120 years, that some of the natural cycles are ~60 years long. We are presently at a convergence and peak of several of those natural cycles. There are suggestions that we are past the peak of some longer solar cycles. I use the words âhintsâ and âsuggestionsâ because of the large errors, lack of global coverage, and wishful thinking adjustments to these measurements. There are two possibilities. If CO2 drives temperature, then temperatures should continue to climb. If it doesnât, then temperatures will fall, then, shortly, CO2 will fall also. Nature is in the process of demonstrating which is which. We can just watch.
- See more at:
http://notrickszone.com/2013/10/08/...-co2-and-not-vice-versa/#sthash.gBOX3Ftl.dpuf