
You are using an out of date browser. It may not display this or other websites correctly.
You should upgrade or use an alternative browser.
You should upgrade or use an alternative browser.
Would you buy or sell based on this chart?
- Thread starter FXforex
- Start date

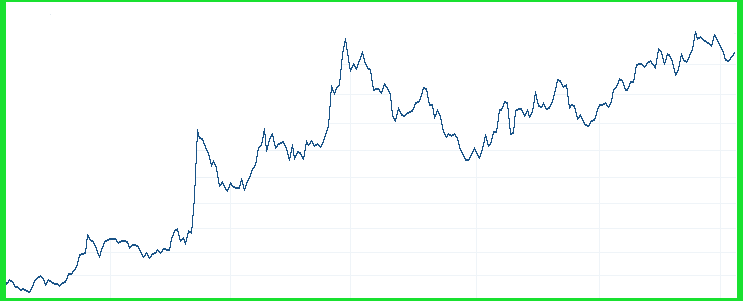
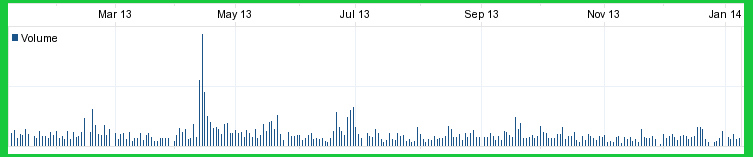
short term [few days] it's a buy-the-dip... longer term I might sell a peak because the acceleration to the long side has slowed but that might be a difficult time because price is at annual highs... have to look at the volume to see what's verified in all cases
sorry, didn't keep up with the thread... It looks like the recent activity was a blowoff top/ double top sort of. I'm guessing that the bull run is over...
Short-term, I'll swing trade a long position. But as for the overall trend, I'd go short once the long swing is over.