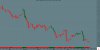
British Pound / US Dollar-GBPUSD As of 31/05/16
*** Intra-Daily Trading Strategy:SELL British Pound / US Dollar
Sell Target: 1.4388
Enter New SELL on OPEN and exit SELL positions at Target price or at Stop price.
(NOTE: Adjust Stop Loss Price according to your trading risk.)
Do not reverse after exiting. This is a recommendation for INTRA-DAY TRADING only!!!!!
A big bearish black candle has formed. Prices closed considerably lower than open. If the candle appears when prices are "high," it may be the first sign of a top. If it occurs when prices are confronting an overhead resistance area, a moving average, trend line, or price resistance level, the long black candle adds credibility to the resistance. Likewise, if the candle appears as prices break below a support area, the long black candle confirms the failure of the support area.
The previous 10 candlestick bars, there are 5 white candles versus 5 black candles.
The previous 50 candlestick bars, there are 24 white candles versus 26 black candles with a net of 2 black candles.
A engulfing bearish line has formed where a black candle's real body completely contains the previous white candle's real body. The engulfing bearish pattern is bearish during an uptrend. It signifies that the momentum may be shifting from the bulls to the bears.
If the engulfing bearish pattern occurs during a downtrend (which is the case with British Pound / US Dollar), it may be a last engulfing bottom which indicates a bullish reversal. The test to see if this is the case is if the next candle closes above the bottom the current (black) candle's real body.MACD is BEARISH as the MACD is below the signal line.
The MACD crossed below the signal line 0 day(s) ago. Since the MACD crossed the MACD moving average, British Pound / US Dollar's price has been unchanged, and has been fluctuating from a high of 1.472 to a low of 1.446.
The MACD is currently not in an Overbought/Oversold range.
There have been no divergence signals during the last 5 periods.
No Stochastic Buy or Sell signals generated today. The last signal was a Sell 1 Day(s) Ago.
The RSI is not currently in a topping (above 70) or bottoming (below 30) range. A buy or sell signal generated when the RSI moves out of an overbought/oversold area. The last signal was a Buy 66 day(s) ago.
Currently the RSI does not show any Failure Swings. The RSI and price of British Pound / US Dollar are not diverging.
Currently, the Momentum Oscillator does not show an overbought or oversold condition.
The ADX is currently below both Plus and Minus Directional indicators. This should not use to initiate any trades right now.
The Directional Movement Indicators (DMI) currently is not indicating a specific price direction. Because this is a trend following system, it should not use to initiate any trades right now. The last Directional Movement Indicators (DMI) signal was a BUY 53 day(s) ago.
A SAR Sell signal generated today. If you are long, this might be a good place to exit.
The close is currently
BELOW its 200 daily moving average
ABOVE its 50 daily moving average
BELOW its 20 daily moving average
The current market condition for British Pound / US Dollar is Bearish
British Pound / US Dollar closed above the lower Bollinger Band by 40.6%. Bollinger Bands are 30.21% narrower than normal. The current width of the Bollinger Bands (alone) does not suggest anything conclusive about the future volatility or movement of prices.
*** Intra-Daily Trading Strategy:SELL British Pound / US Dollar
Sell Target: 1.4388
Enter New SELL on OPEN and exit SELL positions at Target price or at Stop price.
(NOTE: Adjust Stop Loss Price according to your trading risk.)
Do not reverse after exiting. This is a recommendation for INTRA-DAY TRADING only!!!!!
A big bearish black candle has formed. Prices closed considerably lower than open. If the candle appears when prices are "high," it may be the first sign of a top. If it occurs when prices are confronting an overhead resistance area, a moving average, trend line, or price resistance level, the long black candle adds credibility to the resistance. Likewise, if the candle appears as prices break below a support area, the long black candle confirms the failure of the support area.
The previous 10 candlestick bars, there are 5 white candles versus 5 black candles.
The previous 50 candlestick bars, there are 24 white candles versus 26 black candles with a net of 2 black candles.
A engulfing bearish line has formed where a black candle's real body completely contains the previous white candle's real body. The engulfing bearish pattern is bearish during an uptrend. It signifies that the momentum may be shifting from the bulls to the bears.
If the engulfing bearish pattern occurs during a downtrend (which is the case with British Pound / US Dollar), it may be a last engulfing bottom which indicates a bullish reversal. The test to see if this is the case is if the next candle closes above the bottom the current (black) candle's real body.MACD is BEARISH as the MACD is below the signal line.
The MACD crossed below the signal line 0 day(s) ago. Since the MACD crossed the MACD moving average, British Pound / US Dollar's price has been unchanged, and has been fluctuating from a high of 1.472 to a low of 1.446.
The MACD is currently not in an Overbought/Oversold range.
There have been no divergence signals during the last 5 periods.
No Stochastic Buy or Sell signals generated today. The last signal was a Sell 1 Day(s) Ago.
The RSI is not currently in a topping (above 70) or bottoming (below 30) range. A buy or sell signal generated when the RSI moves out of an overbought/oversold area. The last signal was a Buy 66 day(s) ago.
Currently the RSI does not show any Failure Swings. The RSI and price of British Pound / US Dollar are not diverging.
Currently, the Momentum Oscillator does not show an overbought or oversold condition.
The ADX is currently below both Plus and Minus Directional indicators. This should not use to initiate any trades right now.
The Directional Movement Indicators (DMI) currently is not indicating a specific price direction. Because this is a trend following system, it should not use to initiate any trades right now. The last Directional Movement Indicators (DMI) signal was a BUY 53 day(s) ago.
A SAR Sell signal generated today. If you are long, this might be a good place to exit.
The close is currently
BELOW its 200 daily moving average
ABOVE its 50 daily moving average
BELOW its 20 daily moving average
The current market condition for British Pound / US Dollar is Bearish
British Pound / US Dollar closed above the lower Bollinger Band by 40.6%. Bollinger Bands are 30.21% narrower than normal. The current width of the Bollinger Bands (alone) does not suggest anything conclusive about the future volatility or movement of prices.