
You are using an out of date browser. It may not display this or other websites correctly.
You should upgrade or use an alternative browser.
You should upgrade or use an alternative browser.
Will the Nasdaq break it's all time high of 5048 in 2014?
- Thread starter FXforex
- Start date

No
1) No way, hozay!Quote from FXforex:
----Nasdaq is at 4158....
----break it's all time high in 2014?
----chart says....
----5048 reached on March 10, 2000....

2) On a decade-by-decade basis, the year ending in "4" tends to be an "underperformer".

3) Later in the decade is much more likely. We'll see.

Quote from FXforex:
Nasdaq is at 4158, will the Nasdaq break it's all time high in 2014? The chart says yes.
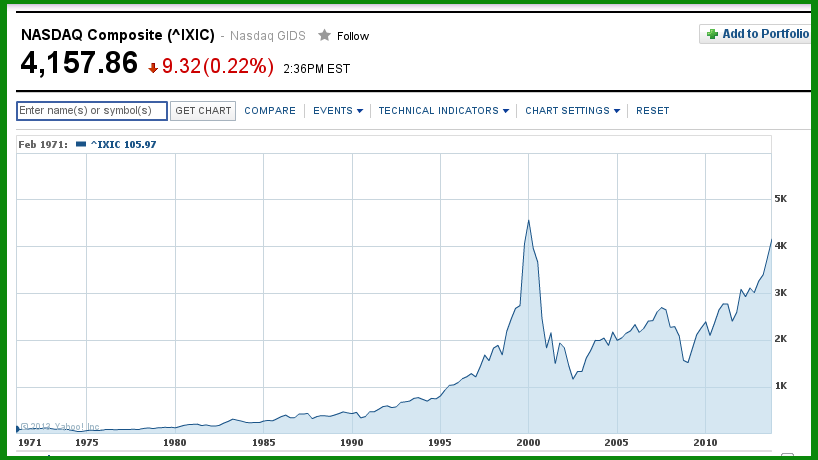
All time high 5048 reached on March 10, 2000
Date Open High Low Close Volume Adj Close*
Mar 10, 2000 5,060.34 5,132.52 5,039.35 5,048.62 1,992,170,000 5,048.62
Mar 9, 2000 4,913.08 5,047.96 4,857.57 5,046.86 2,006,810,000 5,046.86
Mar 8, 2000 4,920.86 4,923.14 4,722.14 4,897.26 2,020,130,000 4,897.26
Mar 7, 2000 4,991.97 5,006.78 4,829.88 4,847.84 2,156,410,000 4,847.84
Mar 6, 2000 4,935.65 4,980.15 4,887.88 4,904.85 2,015,580,000 4,904.85
Mar 3, 2000 4,846.01 4,914.79 4,813.82 4,914.79 2,136,530,000 4,914.79
* Close price adjusted for dividends and splits.
First | Previous | Next | Last
what exactly does adjusted for dividends mean?
the chart suggest a closing high of 4500
2014 or 2015. The bull market will last at least another 2 years.
Probably, yes.
Over the long term, it MUST go up. it HAS too. Fed will ensure that that's the case. It's not a 'real' market. It's completely manipulated, but that's a GOOD thing! We know we will make money on the long side.
Over the long term, it MUST go up. it HAS too. Fed will ensure that that's the case. It's not a 'real' market. It's completely manipulated, but that's a GOOD thing! We know we will make money on the long side.
I predicted nasdaq 5000-6000 about 7 years ago.I was a little early but still better than all the predictions that it would tank and never recover or at least not for many decades