
You are using an out of date browser. It may not display this or other websites correctly.
You should upgrade or use an alternative browser.
You should upgrade or use an alternative browser.
+ Wile E.coyote Warning +
- Thread starter GrandSupercycle
- Start date

Quote from GrandSupercycle:
As mentioned earlier, SP500 / DOW daily chart is very overextended resulting in another Wile E.Coyote scenario.
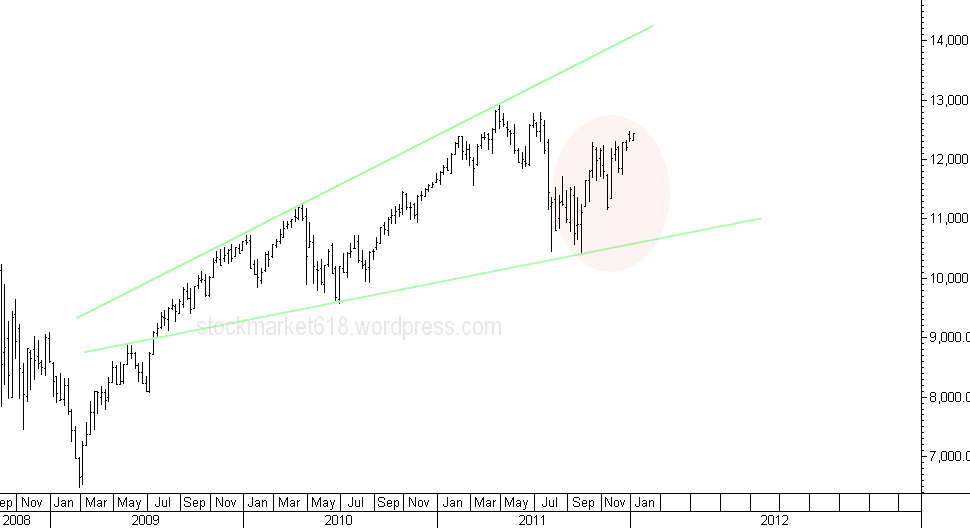
DOW weekly chart below shows updated megaphone as of 10 January. Price action in highlighted area reveals a choppy market lacking consensus and conviction.

Quote from GrandSupercycle:
As mentioned earlier SP500 / DOW daily chart is very overextended resulting in another Wile E.Coyote scenario.
DOW weekly chart below shows updated megaphone as of 10 January. Price action in highlighted area reveals a choppy market lacking consensus and conviction.
+1 He is underwater.Quote from Nine_Ender:
Given he's calling for a massive crash in 2012 taking us below 2008/2009 lows, the declaration of a correction seems stupid even for him. If he really believes in a crash well stop posting this crap, buy your deep otm puts on market indexes, and shut the fk up.
Personally, I didn't find the crash of 2010 or the crash of 2011 that he called to be very impressive. There were some fans on EliteTrader that seriously declared him a great success in August, simply because we finally got a correction. A correction, however, that bottomed out at levels higher then his original short call. So, he has been underwater on all these trades for the enture duration.
Jan 14 2012
NINE ENDER
Please provide evidence to substantiate your claim that analysis enclosed below was originally posted on my blog in August 2010.
And you clearly don't understand that - it was then and remains now - general analysis and does not refer to any particular date.
It is actually a reference to global asset deflation.
You constantly confuse analysis with actual trades.
You do realise there is a difference don't you ?
Trades are posted only on my blog
Nine_Ender alleged on Jan 13 2012 :
'You also posted this call in August 2010. Go ahead post the prices of all those items at that time, and where they are now. Let's see how your trade call performed over 17 months. You always avoid this topic, and pretend you didn't issue the call in August 2010. However, I found it on your blog and posted it on here several times. Again, you ignored all such posts, even had the audacity to claim I was making it up'
Originally posted (on my blog) Feb 16, 2011
âWhen DOW/S&P500 correction gathers momentum I expect:
UP ~ USD, various USDXXX currencies, VIX Index
DOWN ~ EURUSD, AUDUSD, NZDUSD, GOLD/SILVER, Base metals
like COPPER etc, CRUDE OILâ
You posted the same warning recently, yet the chart has changed significantly in three months. So there is something wrong with your analysis.