Quote from IronFist:
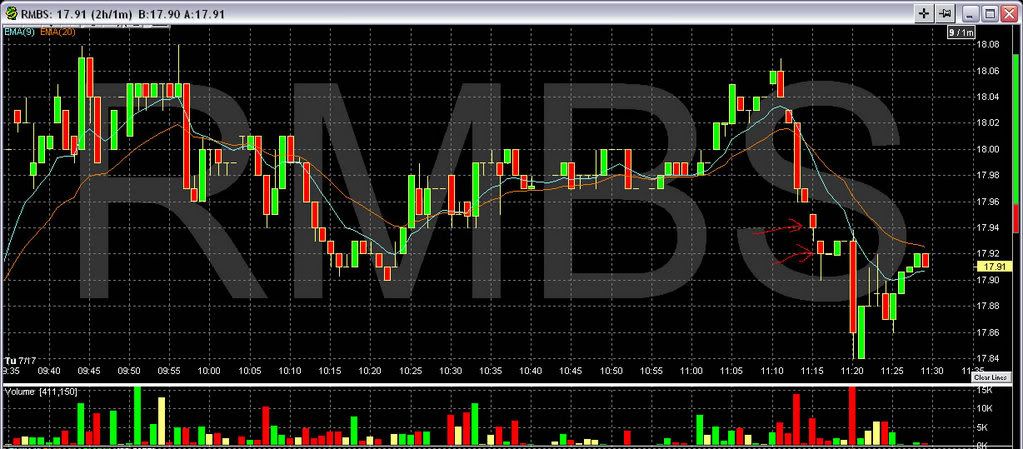
Hammer formation after a significant downtrend, yet neither of them were followed by a reversal.
(7/17/07 RMBS 1 min chart)
I'll repeat my message to you from the prior thread.
Red (dark) Hammer lines are not pattern signals.
If you like them that much at least wait for a
confirmation signal and all the charts you've posted at ET about red hammer lines do not have confirmation signals.
In addition, take a closer look at your candlestick chart...
Look at those 1min intervals where the Open = Close = High = Low (no shadows).
When you see that, your chart interval is to low and you need to increase your chart interval until you no longer see that stuff because that stuff produces too much
price noise for proper Japanese Candlestick analysis.
Hopefully you didn't put any real money on those
unreliable Red (dark) Hammer Lines.
You keep at it this way (not applying it correctly)...
Soon you'll join that group of traders that announce at ET the following...
Japanese Candlesticks don't work.


Quote from IronFist:
I have Nison's Japanese Candlesticks book, "the Candlestick Course." Would you recommend those books/courses in addition?
Those are good books for a
basic understanding of the definitions of Japanese Candlesticks.
They do not provide any trade management information.
Simply, two traders reading the same book will apply different trade management of Japanese Candlesticks.
I will also recommend to you to read my
Trading Hammers (revisited) thread here at ET because there's some trade managment info that goes well with candlestick analysis.
In addition, you will learn about those infamous three consecutive declining red (dark) intervals that appear before any Hammer Lines.
Note: Your RMBS chart has three consecutive declining red intervals before the appearance of your first Red Hammer Line (avoid these types of price action).
Mark
(a.k.a.
NihabaAshi) Japanese Candlestick term