i do not want to sound ungrateful...but i know all of that.
unfortunately, i am looking a little deeper, at how market moves.
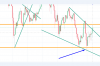
Brooks said that when a trendline break happens, on the downside, look to sell on the upside,as the market tests the trendline, which it has earlier broken..
and if a trendline break happens on the upside, look to buy the 'low', as the market tests the trendline, it has earlier broken
this is very effective but is not easily seen on the chart: it has taken me ten years to draw these lines on the chart.
This is how the market moves by testing highs and then testing lows, so Brooks is a genius
it has taken me ten years to figure how to do this practically
so if you understand this, you will buy low sell high.
if you do not understand, what i am saying, then you will understand, why i did not understand Brooks, when he said the same thing, in his book.