You are using an out of date browser. It may not display this or other websites correctly.
You should upgrade or use an alternative browser.
You should upgrade or use an alternative browser.
Why Is The Obvious Not So Obvious?
- Thread starter nysestocks
- Start date
Let's just say that you're reacting to the past in order to predict the future. You're a smart guy. I'm sure you'll figure it out in no time.It is easy to understand and appreciate a painting after it is painted.
In real time when the artist (market) starts to paint the first candle on the left, I have no idea what he will be painting next.
And I am clueless what to do at 1, 2, 3, or 4 other than wait and watch.
")
thanks, makes senseMae = how much price moves against you, mfe how much price moves in your favor. Suppose your entry is fixed, you can examine the distributions of both return characteristics and dissect it with other variables, eg time. This is also where the old adagium let the winners run comes from. From trend trading perspective, time in 'winning trades' needs to be longer.
Can you see the machine?
After all those years: no...

But thanks for giving another confirmation there's indeed something out there!
Someone told me that the Obvious is best seen in Bitcoin charts; do you agree?
You have a belief about the market concept wrong, imo ironchef.
The market is not an artist.
The market is a machine.
Once you understand that which I did years ago, it becomes easier.
The machine kicks in and out of gear, going forward, backwards and disengages.
But the machine is at times 'overwhelmed' by emotional and erratic retail which causes the machine to disengage.
Sometimes its difficult to differentiate between retail and machine as imo blowoffs could be the deliberate attempts by machine to pop the market up or down to a) escape, b) enter c) reverse.
The machine is clever, tireless, focused, repetitive, predictable.
The machine operates by rules.
The machine is not emotional or artistic, but because the machine disengages, noobs have the wrong impression and jump to wrong conclusions as emotional retail trading takes over.
View attachment 326701
Can you see the machine?
just about the only accurate definition of the market I’ve read in years, coincidentally told to me over a decade back by the best trader I’ve ever met
Attachments
I've said that in the past, Bitcoin behaves very well technically, imo manipulated nicely by the machines/robots.After all those years: no...
But thanks for giving another confirmation there's indeed something out there!
Someone told me that the Obvious is best seen in Bitcoin charts; do you agree?
Can you not see the nice straight (short) trend lines, not in log charts but Linear.
The same angles repeat time and again, but bear in mind while robots operate, so does retail at the same time, so lines/S/R can go out of whack at times.
Markets behave strangely and because I'm not a pro, it's only what I've observed.
Sometimes price looks obviously like being sold off when it's actually being bought and vice versa, ie although buyers and sellers are balanced eg every seller has a buyer, sometimes it looks like heavy selling but actually it is being accumulated by the smarts.
Re your pic, if I see the trend all of a sudden go haywire/volatile, I'm assuming retail have taken over.
Ok here's another lesson, I'm feeling generous today......
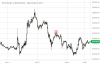
RDN.AX is a penny stock on fhe ASX which is going gangbusters atm, currently trading at 3.9cents.

The chart above is Barchart.com of RDN intraday, 1 minute chart, just one day, Friday, yesterday.
The chart is inaccurate, clumsy because it only shows price stepping in 0.001 cent increments.
O.001 increments is the minimum which is allowed by the ASX on sub 10cent stocks.
HOWEVER institutions are allowed to go even smaller.

Here's the same stock, same day, showing insto moves < 0.001.

This is a small snapshot of trades, same stock on Friday, for example 3.65 is $0.0365.
This is instos engaged in trading this stock but my knowledge is very limited about this, all I know is these sub penny trades are usually very small dollar value for the most part, but here they are a little larger trades than usual, I don't understand what is going on, or why the frequent very small trades.
Maybe it's the broker doing the buying for their clients - dunno.
RDN.AX is a penny stock on fhe ASX which is going gangbusters atm, currently trading at 3.9cents.
The chart above is Barchart.com of RDN intraday, 1 minute chart, just one day, Friday, yesterday.
The chart is inaccurate, clumsy because it only shows price stepping in 0.001 cent increments.
O.001 increments is the minimum which is allowed by the ASX on sub 10cent stocks.
HOWEVER institutions are allowed to go even smaller.
Here's the same stock, same day, showing insto moves < 0.001.
This is a small snapshot of trades, same stock on Friday, for example 3.65 is $0.0365.
This is instos engaged in trading this stock but my knowledge is very limited about this, all I know is these sub penny trades are usually very small dollar value for the most part, but here they are a little larger trades than usual, I don't understand what is going on, or why the frequent very small trades.
Maybe it's the broker doing the buying for their clients - dunno.
Appreciate and thank you for your coaching. Folks like you and @schizo keeping us straight is what makes ET so valuable.You have a belief about the market concept wrong, imo ironchef.
The market is not an artist.
The market is a machine.
Once you understand that which I did years ago, it becomes easier.
The machine kicks in and out of gear, going forward, backwards and disengages.
But the machine is at times 'overwhelmed' by emotional and erratic retail which causes the machine to disengage.
Sometimes its difficult to differentiate between retail and machine as imo blowoffs could be the deliberate attempts by machine to pop the market up or down to a) escape, b) enter c) reverse.
The machine is clever, tireless, focused, repetitive, predictable.
The machine operates by rules.
The machine is not emotional or artistic, but because the machine disengages, noobs have the wrong impression and jump to wrong conclusions as emotional retail trading takes over.
View attachment 326701
Can you see the machine?
We learn by asking questions, again and again until we have the right answer. That said, let me rephrase my statement:
It is easy to understand and appreciate a pattern after it is created by the machine.
In real time when the machine (market) starts to create the first candle on the left, I have no idea what he will be creating next.
And I am clueless what to do at 1, 2, 3, or 4 other than wait and watch.
I am actually doing OK day trading after I use @Buy1Sell2's strict risk management tenet and am able to create a positive expectancy out of it!
The $64,000 question I am trying to find out: Is it random, an illusion or is it real?
Best regards,