You are using an out of date browser. It may not display this or other websites correctly.
You should upgrade or use an alternative browser.
You should upgrade or use an alternative browser.
Why Is The Obvious Not So Obvious?
- Thread starter nysestocks
- Start date
That is actually quite good..it clearly shows why bars can be better than candles!
It depends on how far you zoom out..candles and bars can be very similar when zoomed way out..and very different when zoomed out only a small bit!
Line charts also have their use..again it depends on the trader and what he/she is looking for?
I figured the scale would matter, as charts look about the same if you zoom out far enough.
In the Gif I posted, is there any particular place where this difference is more pronounced? When you say that YOU find more info easier to observe on a bar chart, is it ALWAYS present, or just something that presents itself at certain TIMES?
It has to be there to see it..does it not!
You are getting very serious
")
I'm going to say 90%Here is a question!
What do you think are the chances of the VIX hitting 14.50 by Jul18..currently at 11.11?
Either that or the answer would be, "No way to know."
I'm drawn to the simpler things discussed in this thread, or the more obscure ideas, as the typical TA is something I've been bored with for years now. So this area interests me, and will be one I'll continue to think about this picture for a bit. So my preliminary thoughts are the following:It has to be there to see it..does it not!
You are getting very serious
If I were to attempt to pick out areas that are obviously different, it's simply when candles have a large portion of their construction being made up of wicks. It just looks different. This may not be the key point about their differences? But visually, its what I see initially.
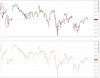
I've circled a few areas where I think the charts just 'look' different, or present a different feel.
But I suspect that's not it. I think it's something LARGER that happens. I.e., super wide ranges that get created.
Attachments
What do you think are the chances of the VIX hitting 14.50 by Jul18..currently at 11.11
That's a funny, or strange, coincidence...I see 1111 and 777 alot -- for years
 (this reply kind of belongs in the Spiritual and Religion forum, I guess)
I've been seeing it...right around when I started trading around 2009/2010'ish -- it's like a divine sign...this is my calling,
You know what I see a lot, '123.' Especially when I was watching either the ES or YM DOM. I dunno if it was present more, or if the software just spit that # out often due to rounding in milliseconds, or just my bias for that number?That's a funny, or strange, coincidence...I see 1111 and 777 alot -- for years

I'm going to say 90%
Either that or the answer would be, "No way to know."
Why do think that..just wondering what the basis might be?