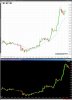
Why don't my IB charts match what I see posted here?

This is most likely going to be a very stupid question, but I have to bite the bullet and just ask because I am at a loss. Reading all the wonderful threads lately and trying to follow them is difficult because when I log into my IB account and try and look up the charts, the data just doesn't match up.

I am attaching a chart for CL from yesterday, Jan 28. I was reading NoDoji's wonderful thread here:

http://www.elitetrader.com/vb/showpost.php?p=3934469&postcount=4

It is apparent that when I look up the chart I am just not getting the same thing. Keep in mind that I am on the west coast so my 9:30 opening is 6:30 for NY time, and I also have it set up to show only the regular trading hours as I'm mostly just looking at stocks. Please refer to my attached picture of what I am getting for the same day, Jan 28, for the same instrument, CL for Mar 2014. What can I be missing here?

(Once my question is answered I hope nobody else replies and keeps it alive so that it can get lost very quickly at the bottom of the page!)
 

Attachments

  • ib charts.jpg
    ib charts.jpg
    216.7 KB · Views: 70
cl opens at 6:00 west coast time. try that.

Ok.. this got me thinking. It turns out that by not having the full 24 hrs shown, I was actually missing the first few hours of the action. No idea why it doesn't display, but where my chart starts for the day, 3 hours of the action is already done. The other thing I notice is that NoDoji's charts are 2 hours offset from NY, whereas I am 3 hours offset from NY. This attached picture seems to match up quite nicely. I used the 1 minute bars as she did and it almost perfectly lines up.

Interestingly enough, on the far right, at the very top, those last few bars don't match up. The highest bar to break 97.40 has a bit of a body on her charts where as mine has no body at all, and the following bar is a red bar whereas my next bar is still a green bar. Should this be acceptable as just a given between different brokers?
 

Attachments

  • 2 charts.jpg
    2 charts.jpg
    202.3 KB · Views: 56
IB data isn't tick by tick, it is a "snapshot" taken

https://www.google.com/search?q=ib+...8&sourceid=chrome&espv=210&es_sm=122&ie=UTF-8

Look on IB's site for definitive description

NoDoji most likely is using a different data feed

for higher timeframe's session settings will have an effect on bar's, i.e.

24 hr settings "session starts" on the hour
CL trading hours "18:00 - 17:15"
RTH settings "session starts" on the 1/2 hour [ref: NYMEX 09:30 - 16:00 EST]

1 minute charts shouldn't have much effect,

also filtered or unfiltered data can have an effect, spike removal etc...

Free online data sources have additional issues, most use Bats exchange data, which will also have discrepancy's

If you want to match an individual's charts, you need determine the data feed, and session settings.

IB data is sufficient for most purposes, trading it is fine.

For longer term analysis a subscription feed is appropriate. It all comes down to what type of trading one performs: HFT, scalp, intraday, swing, investor, multiple instruments, one horse pony, etc...
 
Thanks for the reply! I don't even know what I need to be honest. Just learning so much all at once and trying to absorb most of it. Since I want to trade based on price action, I need to see what everyone else is seeing because if I am going to get in a trade, it would be nice for everyone else to jump in as well to help carry the price along. So if my bar is green but theirs is red, this could be a problem. But I'm sure that IB data will be fine for my needs. I'm just happy that now my charts match up. I would have thought that I should have been seeing the RTH without having to have the option to show all the trading hours selected, but maybe for futures its a little different than for stocks.
 
If IB is your broker, IB data is more than sufficient for your needs.

Regarding session settings, Volume plays a key role for many traders, so they opt not to display lower volume times, hence they configure for RTH. Other traders may trade after hours, and require full session charting.
It is a matter of preference and trading methodology. There isn't a right or wrong setting, you determine what you need when you configure TWS or Charting Platform.

Tip, slow down your time frame. The faster the chart, the greater the difficulty.

1 min / 5 min charts are for experienced intraday traders, the hardest form of trading is intraday.

Color of bars is not important. Price is the constant, if price is going up, you will know. if price is going down you will know, regardless of the color or relationship of any one single bar.

Nodoji, earned the right to trade fast charts due to years of study and honing her plan and technique.

The biggest mistake most novice traders make is attempting to run before they can walk.

If you truly want to learn, be patient.

I don't follow too closely NoDoji or DBphoenix, but from what I have read, both are experienced, transparent and extremely generous with their knowledge. If I were new to trading, I would study them very closely and apply their techniques to higher time frames. If the principles are sound [which theirs are], they will apply to all time frames. Once you develop the ability to identify trends, consolidation, failures, your plan, etc... you can move to faster time frames if you so choose.

good luck,

FYI, CL may not be the most appropriate instrument for a Novice. It is one of the more difficult instruments to trade. It has the capability to chew up and spit out the most experienced of traders. A novice it will swallow whole and spit out the other end.
 
If IB is your broker, IB data is more than sufficient for your needs.

Regarding session settings, Volume plays a key role for many traders, so they opt not to display lower volume times, hence they configure for RTH. Other traders may trade after hours, and require full session charting.
It is a matter of preference and trading methodology. There isn't a right or wrong setting, you determine what you need when you configure TWS or Charting Platform.

This is the funny thing, I needed to show after hours data in order to be able to see that first 3 hours of the RTH for CL. Not sure why the platform wouldn't know, but because of my time zone, I was not seeing the RTH at the ripe old time of 630am for me!

Tip, slow down your time frame. The faster the chart, the greater the difficulty.

1 min / 5 min charts are for experienced intraday traders, the hardest form of trading is intraday.

Color of bars is not important. Price is the constant, if price is going up, you will know. if price is going down you will know, regardless of the color or relationship of any one single bar.

Nodoji, earned the right to trade fast charts due to years of study and honing her plan and technique.

The biggest mistake most novice traders make is attempting to run before they can walk.

If you truly want to learn, be patient.

I don't follow too closely NoDoji or DBphoenix, but from what I have read, both are experienced, transparent and extremely generous with their knowledge. If I were new to trading, I would study them very closely and apply their techniques to higher time frames. If the principles are sound [which theirs are], they will apply to all time frames. Once you develop the ability to identify trends, consolidation, failures, your plan, etc... you can move to faster time frames if you so choose.

The reason I want to trade intraday is because I don't want to hold anything over night. Too much can go wrong and so I prefer to have the control

good luck,

FYI, CL may not be the most appropriate instrument for a Novice. It is one of the more difficult instruments to trade. It has the capability to chew up and spit out the most experienced of traders. A novice it will swallow whole and spit out the other end.
Definitely not looking to trade CL for now, but was just looking to be able to follow the discussion. I like the leveraged ETFs actually, specifically NUGT and DUST. I have seen amazing swings in those. Only thing that worries me is when it gets slow the volume just isn't there.

Anyway.. thanks for the help!
 
About all I can add to Golden's perfect answer is that if I start my Ninja/IB platform later in the day than you start yours our charts may not 'exactly' match up. I've found the historical data can be a bit different to what plots in real time. I've noticed it when I close my platform then reopen it, the chart which has now loaded historical data may have some points a little off from the chart I actually traded. It's not as bad as it may sound.

IB has filtered data as GM said, which will not allow one to plot Tick or Volume charts. For time based charts the data is fine.

I used to have unfiltered data with Zenfire and the IB data 'feels' a bit different. I'm not trading currently but when I get back to it I may consider Kinetick unfiltered data. Not sure right now.

CL volatility has gone down since about a year ago. Perhaps easier now for a newer trader. Depends on the trader. What I like about it is that I 'believe' it to be more of a speculators market and thus the principles of PA work well and reading the market is a bit easier than say the ES. Just my opinion. NQ is showing nice volatility again and I may go back to trading that.

good luck to you.
 
This attached picture seems to match up quite nicely. I used the 1 minute bars as she did and it almost perfectly lines up.

Interestingly enough, on the far right, at the very top, those last few bars don't match up. The highest bar to break 97.40 has a bit of a body on her charts where as mine has no body at all, and the following bar is a red bar whereas my next bar is still a green bar. Should this be acceptable as just a given between different brokers?

The charts I post are QT charts and they're not an absolute match for the more accurate IB charts.
 
The charts I post are QT charts and they're not an absolute match for the more accurate IB charts.

Great to hear that I should trust mine from IB more.. thanks NoDoji. Oh... and would it be asking to much to see a screen capture of how you have your IB platform setup? If its too personal, no worries as I totally understand, I just wonder what you have on the screen, how many charts, where your order entry window is, that sort of thing.

Edit: You would of course have to erase any personal info that might be shown like balances. I had to do it myself when I posted a chart and used Photoshop, so I"m not sure if you have access to something like that so I understand if its not possible.
 
Back
Top