You are using an out of date browser. It may not display this or other websites correctly.
You should upgrade or use an alternative browser.
You should upgrade or use an alternative browser.
Where do the price action trends change on this chart?
- Thread starter 1a2b3cppp
- Start date
Quote from achilles28:
Interesting...what's a sequence change
Means a change from long to short.The sh1t is getting hectic now with Oil,market adds up some steam.Look up!I bought some now,but be carefull to mimic me,as it gets up and down up and down,well,for you...for me it gets left/right,right/left.
Quote from 1a2b3cppp:
I have heard different people say different things about the number of HHs and HLs or LLs and LHs that are needed to have a trend.
Let's assume for the sake of discussion here that there are no double tops or bottoms.
Here is a chart of price behavior:
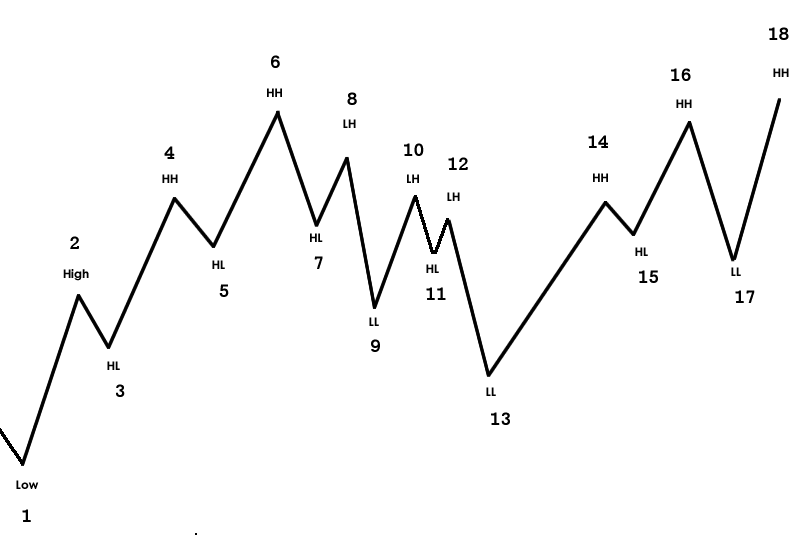
Each point has been numbered.
Look at the chart and say where you would define each trend based on the numbered areas.
For example:
- We are in a confirmed up trend beginning at point 5 and lasting through point 8
- downtrend from 10-11
- no trend from point 11 - 13
- uptrend from 16-17
etc.
I want to have a realistic discussion about price action that accounts for the fact that price doesn't always make nice HH/HL uptrends and LL/LH downtrends.
The first issue I see with your question is how you mechanically identify those Highs & Lows. From a systematic (automated) trading point of view, I think this is more important than where/how to detect a trend change.
When the trend is up, I signal a trend-change to down when the last valid HL (valid = followed by a HH) is taken-out by a large enough margin. Reverse for a down trend, I signal a trend change to up when the last valid LH (valid = followed by a LL) is taken out by a large enough margin.
=> somewhere between 8 & 9, below 5 by enough margin, would be a trend-change to down.
=> somewhere between 14 & 16, above 12 by enough margin, would be a trend-change to up.
From my experience with CL, if focusing on intraday Highs & Lows, there is not enough sustained trends to make up for the chop ... and there isn't enough chop to make it profitable after comms & slippage to do systematic counter-trend either. I have done a lot of statistical analysis to figure where/when to follow trend-changes, and where/when to fade them. And the result P/F is in the 1.4-1.6 range.
Quote from dom993:
The first issue I see with your question is how you mechanically identify those Highs & Lows. From a systematic (automated) trading point of view, I think this is more important than where/how to detect a trend change.
When the trend is up, I signal a trend-change to down when the last valid HL (valid = followed by a HH) is taken-out by a large enough margin. Reverse for a down trend, I signal a trend change to up when the last valid LH (valid = followed by a LL) is taken out by a large enough margin.
=> somewhere between 8 & 9, below 5 by enough margin, would be a trend-change to down.
=> somewhere between 14 & 16, above 12 by enough margin, would be a trend-change to up.
From my experience with CL, if focusing on intraday Highs & Lows, there is not enough sustained trends to make up for the chop ... and there isn't enough chop to make it profitable after comms & slippage to do systematic counter-trend either. I have done a lot of statistical analysis to figure where/when to follow trend-changes, and where/when to fade them. And the result P/F is in the 1.4-1.6 range.
Whoa, a specific answer!
Do you find a lot of slippage on the CL? That's one of the instruments I've been watching the DOM for recently to try and learn how the DOM works.
Quote from 1a2b3cppp:
Do you find a lot of slippage on the CL?
I use IB and pure STP orders (my understanding is that these orders reside on the IB servers, I would have to use STPLMT to have orders at the CME), in that setting I have an average 1-t slippage for my stops (which are always placed under a S / above a R, and very much exposed to slippage).
I have 1 system using MKT orders only, about 2/3 of the entries are against the immediate price direction, and it has in real-trading about 1/2-tick slippage per order vs fills in backtest (no slippage configured for backtest), using 1-sec TF for fills in Ninja.
Quote from 1a2b3cppp:
Can you elaborate? How do you know if a LL is part of an uptrend or the beginning of a downtrend?
Your hypothesis that began the thread is flawed. Drop this quest.
You are seeking. and your path is very erratic and not based on acquiring data in any sense. You will find no results.
In ET, explanations do not work. For example, see Pekelo incorrectly demonstrating that he does not know how and when brokers collect their fees (three others commented incorrectly as well).
There is a seed of knowledge and skill with respect to HH, Hl's, LL, and LH's. It is limited to one thing that can later enable a learner. IT IS:
"To make a valuation, there is a requirement to use two bars on a TF."
See if you can "get this idea" and put it in your mind. Then see if you can begin to deal with the EVENTS that happen in markets.
By reasoning with a pencil and blank sheets of paper, you can build the system of market operation. Be sure to put both market variables on each drawing you do.
It is okay to begin simply. A giant step occurs when you finally use both market variables instead of just the dependent variable.
Start a journal. and just begin simply with thought filled simple drawings.
FYI: In trading, service costs are taken from your account immdeiately, After hours once a day is when settlement for tyour account occurs.
Attached is my sequential trading summary in terms of points/contract. The net today was 25.0 points in ES/contract.
