Quote from Paddler:
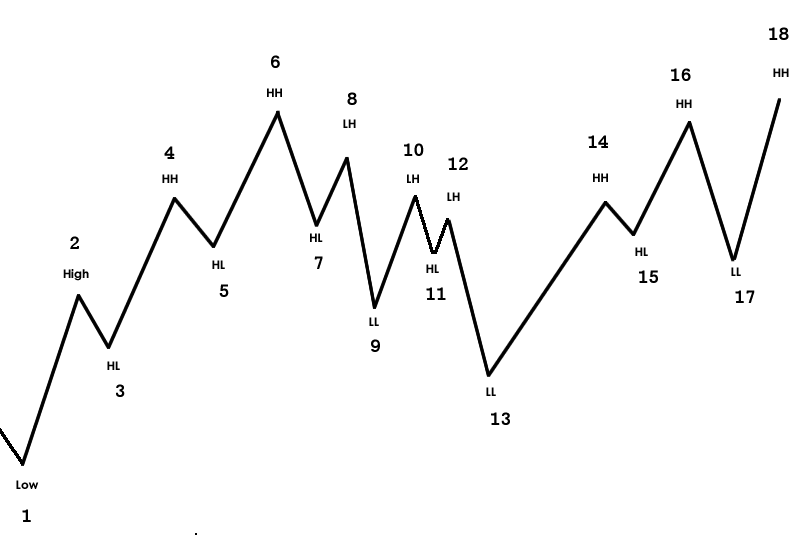
What a chart! But you have jumped fractals. You do not know the subtle differences. That is why you do not feel support, comfort and confidence when you look at the chart.
It is just as confusing as Elliot waves, LOL.
HTH
Paddy,do you enjoy trading and earn at the same time?