I have heard different people say different things about the number of HHs and HLs or LLs and LHs that are needed to have a trend.
Let's assume for the sake of discussion here that there are no double tops or bottoms.
Here is a chart of price behavior:
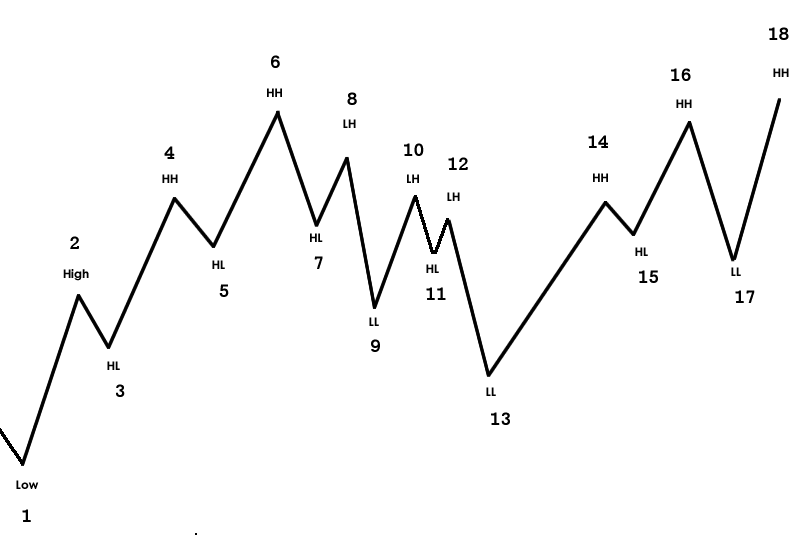
Each point has been numbered.
Look at the chart and say where you would define each trend based on the numbered areas.
For example:
- We are in a confirmed up trend beginning at point 5 and lasting through point 8
- downtrend from 10-11
- no trend from point 11 - 13
- uptrend from 16-17
etc.
I want to have a realistic discussion about price action that accounts for the fact that price doesn't always make nice HH/HL uptrends and LL/LH downtrends.
Let's assume for the sake of discussion here that there are no double tops or bottoms.
Here is a chart of price behavior:
Each point has been numbered.
Look at the chart and say where you would define each trend based on the numbered areas.
For example:
- We are in a confirmed up trend beginning at point 5 and lasting through point 8
- downtrend from 10-11
- no trend from point 11 - 13
- uptrend from 16-17
etc.
I want to have a realistic discussion about price action that accounts for the fact that price doesn't always make nice HH/HL uptrends and LL/LH downtrends.
