
Yes, of course, an indicator such as a moving average, lags price. But, in the sense of looking for a potential setup, they can also forecast.
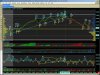
The attached chart is comprised of Renko bars which are based on price change rather than time. The setting here is 6 ticks, or 3 pips. I like Renko bars for setups because they smooth out the price action vs time bars and show support and resistance very well. Much less noise than time bars, which I like better for refining entry. The text shows 1) a higher-high (HH), lower-high (LH), lower-low (LL), higher- low (HL); 2) the duration of each wave; 3) the total volume of each wave.
The chart shows a signal in the ellipse at the yellow bar, which is the alert. Alerts occur several bars following the high or low, because the wave doesn't complete and then the next wave start until there is at least a two bar reversal. This gives later signals since it's several bars after the actual reversal but it cuts out a lot of noise and gives more relevant signals, so it's a trade-off - later entry but better signals.
On the right is the histogram for volume-by-price, or Volume Profile (VP), for the last six days. The yellow area at bottom is the Value Area (VA) where 70% of the volume at price occurred over that period. The brown horz lines are the Rejection Areas, where the least amount of volume occurred during this period, where price was quickly rejected and (usually) reversed.
On the left is the VP for the current trading session. The yellow area and white horizontal lines are the VA for the session, the yellow horz line is the Volume Point of Control (VPOC), the price at which the most volume occurred during the session.
From the far left to 1, there is a strong uptrend of 197 ticks. From point 1 to 2, price struggles, the waves more brief on declining volume and gaining only 58 ticks at the high, at 2. Here price has formed a wedge, is well-above the VA high (for the session at the time) late in the session, at the high of the day and at one of the 6-day rejection areas.
In the 4th pane is the Delta Momentum 5-period simple moving average. Note the strength of the MA during the uptrend to point 1. From 1 to 2 it forms an apex and considering we're in an uptrend and the aggressive buying momentum is declining while price gains, there's a clear divergence. The price/wave volume behavior and the Delta tell us price is either reaching some kind of equlibrium or becoming overbought, so we can expect either consolidation or reversal.
The final wave is on considerably higher volume while Delta momentum MA forms a lower-high. This is the signal - Higher-high, higher volume, DMMA lower-high, based on Wyckoff effort vs reward with the Delta added because I think it's a good way to gauge the force of a move that, who knows, Wyckoff might have appreciated.
Anyhoo, back to the original point - the divergence of price and the indicator, considered with other criteria I've mentioned, are actually forecasting, or at the very least confirming, possible price action. So, in that sense, not so lagging.
Harold
The attached chart is comprised of Renko bars which are based on price change rather than time. The setting here is 6 ticks, or 3 pips. I like Renko bars for setups because they smooth out the price action vs time bars and show support and resistance very well. Much less noise than time bars, which I like better for refining entry. The text shows 1) a higher-high (HH), lower-high (LH), lower-low (LL), higher- low (HL); 2) the duration of each wave; 3) the total volume of each wave.
The chart shows a signal in the ellipse at the yellow bar, which is the alert. Alerts occur several bars following the high or low, because the wave doesn't complete and then the next wave start until there is at least a two bar reversal. This gives later signals since it's several bars after the actual reversal but it cuts out a lot of noise and gives more relevant signals, so it's a trade-off - later entry but better signals.
On the right is the histogram for volume-by-price, or Volume Profile (VP), for the last six days. The yellow area at bottom is the Value Area (VA) where 70% of the volume at price occurred over that period. The brown horz lines are the Rejection Areas, where the least amount of volume occurred during this period, where price was quickly rejected and (usually) reversed.
On the left is the VP for the current trading session. The yellow area and white horizontal lines are the VA for the session, the yellow horz line is the Volume Point of Control (VPOC), the price at which the most volume occurred during the session.
From the far left to 1, there is a strong uptrend of 197 ticks. From point 1 to 2, price struggles, the waves more brief on declining volume and gaining only 58 ticks at the high, at 2. Here price has formed a wedge, is well-above the VA high (for the session at the time) late in the session, at the high of the day and at one of the 6-day rejection areas.
In the 4th pane is the Delta Momentum 5-period simple moving average. Note the strength of the MA during the uptrend to point 1. From 1 to 2 it forms an apex and considering we're in an uptrend and the aggressive buying momentum is declining while price gains, there's a clear divergence. The price/wave volume behavior and the Delta tell us price is either reaching some kind of equlibrium or becoming overbought, so we can expect either consolidation or reversal.
The final wave is on considerably higher volume while Delta momentum MA forms a lower-high. This is the signal - Higher-high, higher volume, DMMA lower-high, based on Wyckoff effort vs reward with the Delta added because I think it's a good way to gauge the force of a move that, who knows, Wyckoff might have appreciated.
Anyhoo, back to the original point - the divergence of price and the indicator, considered with other criteria I've mentioned, are actually forecasting, or at the very least confirming, possible price action. So, in that sense, not so lagging.
Harold
Attachments
Last edited:


