

Bookmap
Sponsor
What are the challenges using a traditional DOM? Well, it’s limited only to current market data. Once the numerical values update in the DOM, then the data is lost. We’d have to memorize what occurred at these specific price levels, track if liquidity was pulled, added, or transacted.
But what if we could record all of this activity and graphically plot in on the chart historically? It’d certainly be easier to read, but could also allow for many other insights:
Bookmap’s heatmap and volume visualization allows traders to see all of this. In addition, traders can easily spot areas of absorption, exhaustion, and critical price pivot areas.
Moreover, you can zoom out and see all of this phenomena on much higher time frames. Try using the DOM on higher time frames; it’s nearly impossible.
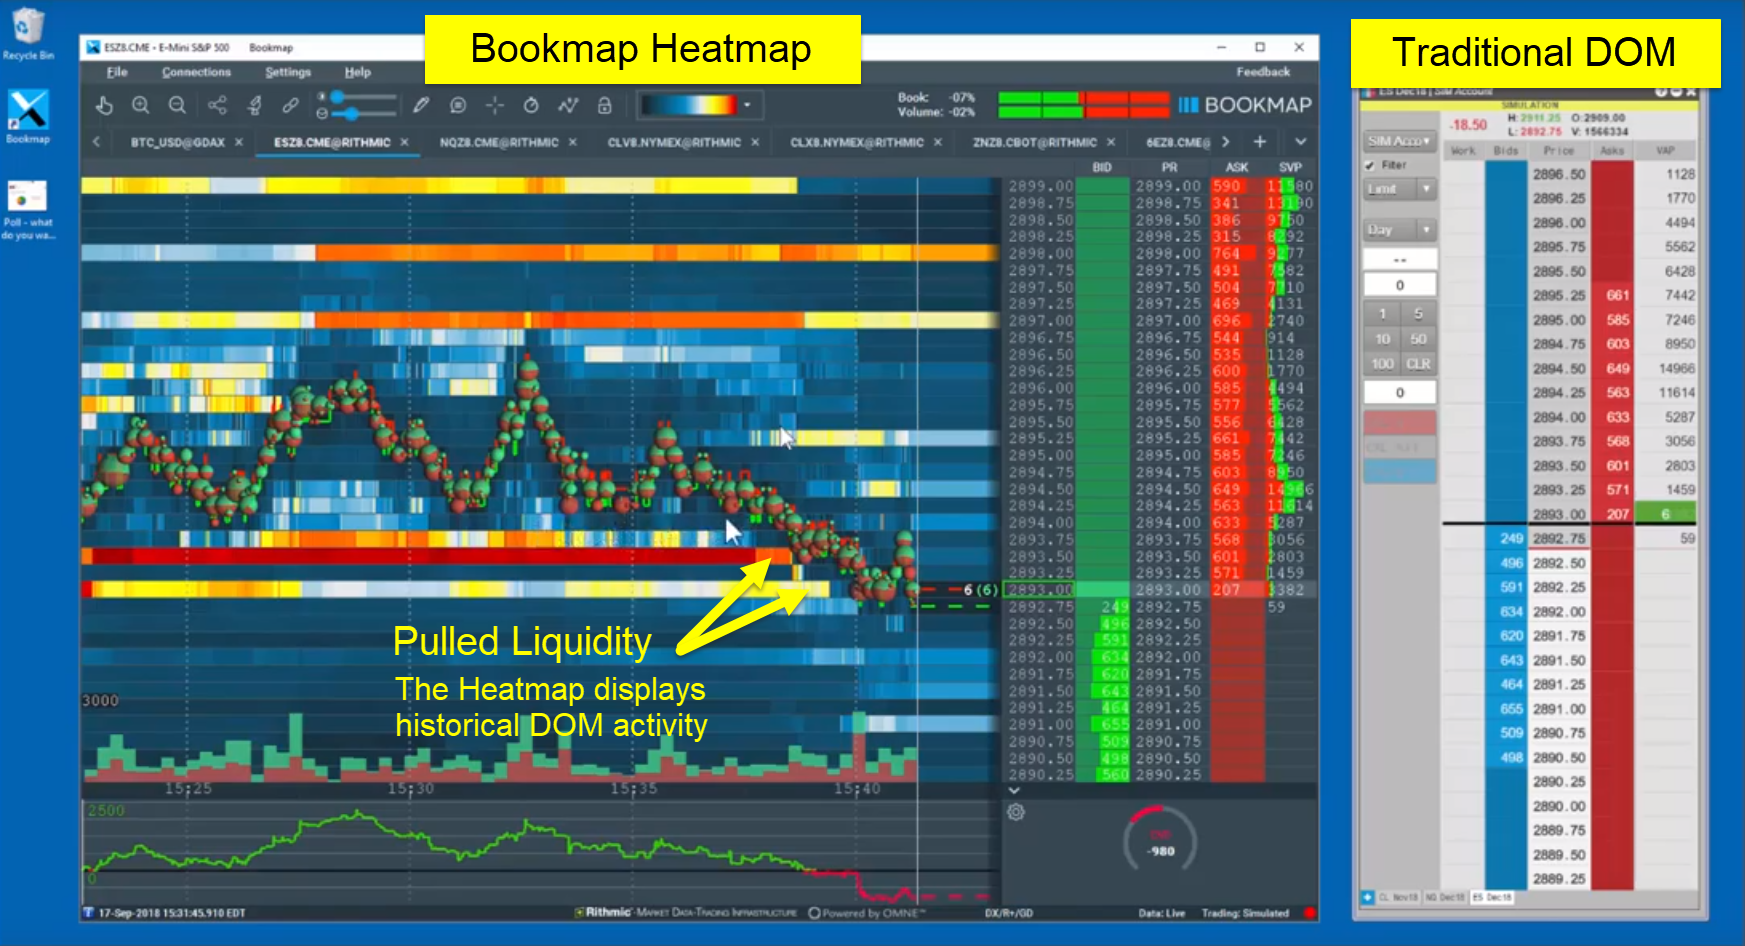
Take a look at a few specific video examples, and share your thoughts!
https://www.bookmap.com/dom_compare/
But what if we could record all of this activity and graphically plot in on the chart historically? It’d certainly be easier to read, but could also allow for many other insights:
- We could easily see how long the liquidity stayed in the market and verify if it was pulled, added, or transacted.
- We could easily spot specific larger players and algorithmic activity
- We could begin reading the context of the liquidity compared to the aggressive volume, and price structures for both low and high time frames.
Bookmap’s heatmap and volume visualization allows traders to see all of this. In addition, traders can easily spot areas of absorption, exhaustion, and critical price pivot areas.
Moreover, you can zoom out and see all of this phenomena on much higher time frames. Try using the DOM on higher time frames; it’s nearly impossible.
Take a look at a few specific video examples, and share your thoughts!
https://www.bookmap.com/dom_compare/


