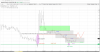
It says at the top left corner, I guess it's a bit dark to be able to see.
The ticker is CPTA, the entry was marked by a yellow line above the last candle on the right-hand side, the line represents the price 2.76.
You have to focus on the Big picture rather than the P thing.
Big picture :
peak price was around $20. price has been going down since 6 years ago.
Recently price went down decisively ( this is the 3rd decisive down movement ) in early Mar 20, after breaking the rising trend line.
Subsequently, from mid Mar onwards, price is moving in range (around 2 to 4.5 level).
question traders might ask is : will there be 4th decisive down movement?
I see that there was significant increase in volume on 15 Jul , Wednesday.
That was probably the day you longed the stock.
Personally, at this moment, I'd find it difficult to profit from trading such stocks.
If I were to trade such stocks, I'd trade with very small quantity