
You are using an out of date browser. It may not display this or other websites correctly.
You should upgrade or use an alternative browser.
You should upgrade or use an alternative browser.
What is the rationale behind trendlines?
- Thread starter CyJackX
- Start date

Trendlines are useful for several reasons, among them:
1) they clarify the trend itself. While one could argue you don't need them ...just a visual looking at the price bars will indicate the trend. That is true, however, our minds focus easier on a trend that is clarified as opposed to one that is hazy. There are trends within trading ranges and there are trading ranges within trends. The mind can perhaps pick one out to the neglect of the other. Trendlines serve to clarify and to focus.
2) trend lines are basically 1/2 of a channel. Channels can be steep and strong or more horizontal and weak. The market tends to go from breakouts to diagonal channels to sideways ranges then repeats. In otherword, the markets go from steep or almost vertical channels to diagonal channels to sideways channels. The markets are ALWAYS in a channel. Some sort of a channel! The diagonal posture of the trendline channel is an indication where price is at in the process. Price generally has a tendency to continue doing what it is doing until acted upon by another force. Trendlines (which can be labeled channels) clarify the forces as either weak and waning or strong and waxing stronger or weak and getting stronger or stronger and getting weaker.
3) trendlines indicate the cycle the market is in or about to enter. In a strong b.o. you are going to see a steep or almost vertical trendline. As that breakout (which is really just an extreme channel) begins to transition into a broader channel (characterized by pullbacks..mini sideways ranges..) trendlines help clarify that transition because they begin to appear on the chart with less of a slope. As they do so the channel broadens into a weaker channel that begins to have p.b.'s (and the p.b.'s tend to get longer as time passes ) which may or may not affect your trading from a tactical nature. For instance, if you love trading p.b.'s as they get longer you may refrain from taking a position on the first b.o. of a p.b. And wait for a second entry or a third....etc
4) all diagonal channels are trendlines and all trendlines are channels. all channels are ranges. All ranges contain price behaviour. All ranges have support and resistance (that is why they are ranges). The top of a sideways range is where resistance has formed. The bottom is where support has formed. Most breakouts from a range fail (70% to 80%) and price gets sucked back into the range. Until one b.o. does finally succeed. Hence if you love buying at support and selling at resistance you may like using a system that highlights those entries. Now diagonal channels ARE ranges. They just are diagonal. Trendlines highlight the slope of the channel. Hence the strenght or weakness of the channel is highlighted via trendlines. Second trendlines highlight and clarify support and resistance in a channel. These are points of failure. Remember, most b.o. fail UNTIL one b.o. does succeed. But the odds strongly favor b.o. failures. Hence if you love trading support and resistance you could use trendlines to indicate the areas of support and resistance of price that is contained within the trendlines or channel. Now knowing this: that these points fail at least 70% of the time and price is sucked back into the channel after a b.o. would that not determine the tactic you might employ as price approaches a trendline? The top trendline or the bottom trendline.
Bottom LINE LOL. Trendlines are useful. They also highlight and clarify things moving averages cannot. On the other hand m.a. highlight things trendlines cannot.
1) they clarify the trend itself. While one could argue you don't need them ...just a visual looking at the price bars will indicate the trend. That is true, however, our minds focus easier on a trend that is clarified as opposed to one that is hazy. There are trends within trading ranges and there are trading ranges within trends. The mind can perhaps pick one out to the neglect of the other. Trendlines serve to clarify and to focus.
2) trend lines are basically 1/2 of a channel. Channels can be steep and strong or more horizontal and weak. The market tends to go from breakouts to diagonal channels to sideways ranges then repeats. In otherword, the markets go from steep or almost vertical channels to diagonal channels to sideways channels. The markets are ALWAYS in a channel. Some sort of a channel! The diagonal posture of the trendline channel is an indication where price is at in the process. Price generally has a tendency to continue doing what it is doing until acted upon by another force. Trendlines (which can be labeled channels) clarify the forces as either weak and waning or strong and waxing stronger or weak and getting stronger or stronger and getting weaker.
3) trendlines indicate the cycle the market is in or about to enter. In a strong b.o. you are going to see a steep or almost vertical trendline. As that breakout (which is really just an extreme channel) begins to transition into a broader channel (characterized by pullbacks..mini sideways ranges..) trendlines help clarify that transition because they begin to appear on the chart with less of a slope. As they do so the channel broadens into a weaker channel that begins to have p.b.'s (and the p.b.'s tend to get longer as time passes ) which may or may not affect your trading from a tactical nature. For instance, if you love trading p.b.'s as they get longer you may refrain from taking a position on the first b.o. of a p.b. And wait for a second entry or a third....etc
4) all diagonal channels are trendlines and all trendlines are channels. all channels are ranges. All ranges contain price behaviour. All ranges have support and resistance (that is why they are ranges). The top of a sideways range is where resistance has formed. The bottom is where support has formed. Most breakouts from a range fail (70% to 80%) and price gets sucked back into the range. Until one b.o. does finally succeed. Hence if you love buying at support and selling at resistance you may like using a system that highlights those entries. Now diagonal channels ARE ranges. They just are diagonal. Trendlines highlight the slope of the channel. Hence the strenght or weakness of the channel is highlighted via trendlines. Second trendlines highlight and clarify support and resistance in a channel. These are points of failure. Remember, most b.o. fail UNTIL one b.o. does succeed. But the odds strongly favor b.o. failures. Hence if you love trading support and resistance you could use trendlines to indicate the areas of support and resistance of price that is contained within the trendlines or channel. Now knowing this: that these points fail at least 70% of the time and price is sucked back into the channel after a b.o. would that not determine the tactic you might employ as price approaches a trendline? The top trendline or the bottom trendline.
Bottom LINE LOL. Trendlines are useful. They also highlight and clarify things moving averages cannot. On the other hand m.a. highlight things trendlines cannot.
Last edited:
Trendlines are one of the core pillars of my own trading personally. A lot of good points have been made here. Sure, they aren't respected 100% by price to the tick, but any proficient user of them knows they aren't intended to be. But for the large part I've found they are extremely effective in containing and framing the movement of price when applied correctly and consistently.
If anything, they are extremely useful for cutting down the amount of information a trader is required to consider. I've found it a lot easier to analyze and react to price movement when it's contained in a defined area. Whether it's horizontal S&R or the dynamic range of a trend channel; framing your area of operation and providing hard bounds for the life of your trade is a great tool for simplification; and I've seen simplicity often end up being the key to the profitability barrier for a lot of traders once they finally throw in the towel and actually apply it rigorously.
If anything, they are extremely useful for cutting down the amount of information a trader is required to consider. I've found it a lot easier to analyze and react to price movement when it's contained in a defined area. Whether it's horizontal S&R or the dynamic range of a trend channel; framing your area of operation and providing hard bounds for the life of your trade is a great tool for simplification; and I've seen simplicity often end up being the key to the profitability barrier for a lot of traders once they finally throw in the towel and actually apply it rigorously.
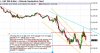
Trend lines are very valuable to me as they show you where market makers have built inventory. They also clearly show where a significant portion of traders placed their stops. If you go on any social media where retail traders congregate you will see they love to play trendlines. Given the majority of this group of traders lose money consistently why would you want to make decision in the same way as them. If you think logically its the same thing as expecting a vegetarian to know how to cook a good steak.
The reality of trendlines is that they sometimes work and they sometimes dont. Just the same as fibonacci, moving averages, stochastics etc. Some of the time any of these tools will work, other times they wont, that's the hook for the trader to get them locked in to gamblers fallacy.
What is actually happening is you are being gamed.
The reality of trendlines is that they sometimes work and they sometimes dont. Just the same as fibonacci, moving averages, stochastics etc. Some of the time any of these tools will work, other times they wont, that's the hook for the trader to get them locked in to gamblers fallacy.
What is actually happening is you are being gamed.
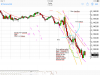
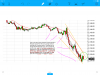
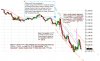
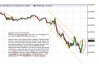
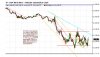
Here is how things went while i was gone. Anyway this is how i use trendlines ...channels...etc. The market is always in a trend..a channel..a range. ALWAYS. YOU MAY not always see it at first but it is. all my posts even have smaller patterns..trendlines...channels..wedges..triangles..etc that i didn't mark up. Trendlines are one tool that helps one to focus. PA is full of uncertainties. The best we can do is try and get a slight edge. Any tools that help us do that are hence useful tools. There are so many unknown variables in the markets but PA structure can give us a handle to grip on but like most anything else it isn't perfect but it does give us an edge, if we can learn to read it correctly.
Attachments
Last edited: