You are using an out of date browser. It may not display this or other websites correctly.
You should upgrade or use an alternative browser.
You should upgrade or use an alternative browser.
What is the most influential technical tool from the following list
- Thread starter athlonmank8
- Start date

%%a pile of garbage.
One mans or womans trash is another's treasure.LOL I see your points; I just voted in his poll [moving aVerages]. A lot of my candles are colored red + blue.Thats another reason I don't trust polls much, he really did not have my exact answer+my exact colors. Merry Christmas, Happy Hanukah/holidays
I have backtested some of this stuff across hundreds of stocks and ETFs going back to 2008 (I could have gone back farther, but limited the scope to after 2007). I looked at forward returns over periods of 5, 10, 15, 20, 25, 30, 35, 40, and 45 days. Submitted each set of returns to a t-test against randomly sampled entries. Looked at long entries only. End result, only buying at the lower keltner bands produced a statistically significant edge relative to random entries and only for a subset of instruments (less than a quarter...in other cases, there were surplus returns over random entry, but not statistically significant). I did not see any kind of edge from buying at 50, 100, or 200 EMA or using MACD cross-overs relative to random entries that was statistically significant. Actually, for the MACD, I found surprisingly that buying when the signal line is below 0 is better than buying when it is above zero. Maybe that makes sense given the history. Buying the dip has worked well since 2008. Although pretty much everything produced a positive return because the market mostly went higher over that period so even random entry "worked".
For those that have luck with the moving averages, I'm curious as to how you use them. I'm guessing that they are mostly used as a filter for another signal.
For those that have luck with the moving averages, I'm curious as to how you use them. I'm guessing that they are mostly used as a filter for another signal.
Last edited:
%%Probably the best poll this year (?)
but where is ichimoku clouds ?
Maybe like a fast sto…………. so good or so useless for profits; best no to mention it much LOL-LOL
,I know some people discount trendlines, support and resistance, and other chart patterns, but Tim Knight over at another website has been relying on those methods for years and only shorts stocks. If he's able to make money doing that for the past decade despite the strong bull market, then that stuff must work (assuming that he actually makes money trading and does not just sell charting software and subscriptions).

Aren't they essentially the same? Channel is basically TWO parallel trendlines."7" Channels -- applied "Reversion-To-Mean" -- nice while it works...
"2" Trendlines -- I would rely upon Moving Averages, but I've lately seen Trendlines described *without* having been derived from Moving Averages I would not want to be seen as part of that [sad] camp.

%%Aren't they essentially the same? Channel is basically TWO parallel trendlines.
No, not the way he worded it. I've see straight trendlines drawn all over the pace, biggest mess I've ever seen, except for grids======== not really trendlines -no wonder so many hate TA/straight lines.LOL……………………………………………………………………………………………………….
IMHO the opening price (what's happening now) is more important.Closing price is probably the best signal
TA followers are like the protestants. Like there are sooooooooo many different denominations in the protestant movement, TA abounds with never-ending interpretation. There's no end in sight. So I say, to each their own. Peace.No, not the way he worded it. I've see straight trendlines drawn all over the pace, biggest mess I've ever seen, except for grids======== not really trendlines -no wonder so many hate TA/straight lines.LOL
a pile of garbage.
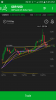
Here's one of my entry edges. **This works better when daily and Weekly candles are setting new highs.** Long GBP/USD off of 1.3000. Trendline confluece with moving averages and the previous high break increases the probability. On the intraday the 4hr 20 periods are above price so this trade isnt a done deal yet(this is important).
I did not include the channels but it's funny, the top 3 things in this poll are the top 3 things that work great when combined properly. The quants are using math very similar to this.
This most important thing after the entry is trade management and cutting losses. Since 40 pct of my trades are losers I cut losses accordingly.