Sunday open and sp500 could gap down 100 points.
Pull up the price ladder at about 5:50 PM ET tomorrow night, and you will know exactly the gap down.
Sunday open and sp500 could gap down 100 points.
Sunday open and sp500 could gap down 100 points.
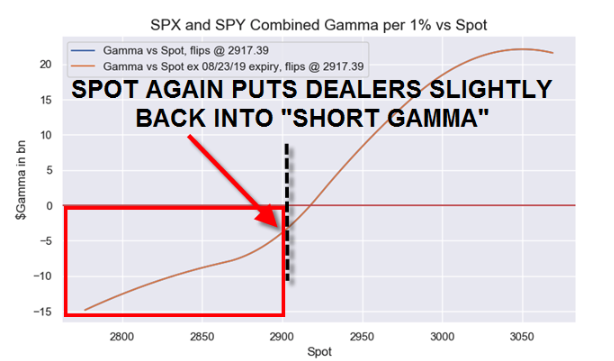
There are massive short gamma positions (by dealer desks) as the SPX approaches the 200 day MA level of around 2800. The negative gamma hedging is going to accelerate as we approach this level. If this level (200 day MA) doesn't hold, it's lights out for the stock market.
We could see a >5% gap lower and the VIX cash explode to 30%, if the market gaps down to 2600.
Get ready to buy any resting puts in the book on this market melt-down...guaranteed big winner and a trip to the Porsche dealership.
What about position players, perhaps not so wise, who would buy their puts "late" -- if mkt gets to 200SMA, might one expect a frenzy of put buying, strikes @200SMA and lower, to buoy the mkt, so that even if it goes lower, it will halt not too far away (20 MONTH SMA ?)
Also, it's supposedly common for price to bounce off the 200SMA. Is it possible that nevertheless, there's also usually a lot of short gamma at the 200SMA ?
I realize you said "if" mkt gets below 200SMA, you weren't predicting it would. Perhaps it's typical for such a dip not to happen ?
"Curious, as no option can create a 'net' positive or negative gamma position, why do you assume the positive gamma side will be doing nothing?"
Good point. But I think the assumption of this chart, which I extracted from a reputable Seeking Alpha contributor, is that a majority of the positive gamma positions are long equity portfolio managers who are big buyers of downside protection, along with speculators (directional players) looking for a market crash. Unlike the derivatives desks (short gamma position holders), the positive gamma holders are not vol or delta neutral players looking to scalp futures or stock, or profit from a spike in vol. They have simply loaded up on OTM puts to protect their equity longs, or to speculate on direction. The expensive gamma they paid for is just gravy on top if the market blows through their long strikes.
So when the market starts gapping lower, the negative gamma players are frantically selling futures or stock to stay flat deltas, while the positive gamma holders are letting their put deltas ride to offset their long equity losses, or are looking to cash out buy selling out their naked long puts. Very few positive gamma holders (unless you are one of the few vol players/delta neutral traders long downside) are buying futures or stock on a market melt-down, while there are plenty of negative gamma futures/stock sellers as the market starts to decline. Helps explain much of the underlying behavior.
I also think the chart shows a very common position for S&P 500 groups: long OTM calls and short OTM puts. I know a bunch of groups that always have this position. In addition, they are usually net short option premium, always under-hedge the calls and/or over-hedge the puts, and are long lots of "teenie" puts in case something really bad happens.
I never will understand that. To trade a market day in and day out waiting for an event, possibly for years, then when that event occurs you are not set up to rip the cover off the f'n ball, and instead spend that day trying to bail your ass out of trouble, when you should be moving into your longs and jizzing all over yourself watching vol pop and your delta (that you've already 'partially' hedged twice) again reaching embarrassing proportions.
No better feeling in the world than when after you "jack" your vols up, you realize you have a boatload of futures/stock to buy while the market is crashing.
