You are using an out of date browser. It may not display this or other websites correctly.
You should upgrade or use an alternative browser.
You should upgrade or use an alternative browser.
What are your thoughts on this one?
- Thread starter cashclay
- Start date
If you see smaller incremental distance between pivots, this would show on Oscillators as divergences. It is good to know what Oscillators should be doing in relationship of price if you are going to use them. RSI or MACD is good to show chop when it holds area around 50 or 0 depending on middle of indicator..
Attachments
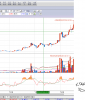
you wrote that the pros had stopped buying. can i ask first why you thinks its pros and not just regular people. And how are you telling me that when there is a long wick at the top with a pretty decent size candlestick (in relation to the others) that this means you should get ready to sell? And im really sorry but what do you mean that stiar is stopping on smaller breaks or pivot highs? That the stair are getting higher but on smaller consolidations channels? Sorry i really need to understand mroe of the lingo
You definitely should learn how to trade oscillators if you are day trading/scalping. My favorite are the MACD, Stochastic, William's %R, and RSI. Those are the most popular as well. A tricky thing to learn but very crucial is being able to see hidden divergence in the oscillator. Look up hidden divergence, and read about it. It takes some time to understand but is well worth it.you wrote that the pros had stopped buying. can i ask first why you thinks its pros and not just regular people. And how are you telling me that when there is a long wick at the top with a pretty decent size candlestick (in relation to the others) that this means you should get ready to sell? And im really sorry but what do you mean that stiar is stopping on smaller breaks or pivot highs? That the stair are getting higher but on smaller consolidations channels? Sorry i really need to understand mroe of the lingo
I would also recommend taking a look at this website, http://followthechart.com/trade-reviews/. They don't day trade but it helped me tremendously to learn technical analysis skills. You can use these concepts when scalping and day trading as well. I would look over the trade reviews and also the upcoming trades to see what stocks you might want to trade during the week.
If takes out lows, for me to be shorthey thnaks for the feedback. so do yuo think it is going to go down or up?
you wrote that the pros had stopped buying. can i ask first why you thinks its pros and not just regular people. And how are you telling me that when there is a long wick at the top with a pretty decent size candlestick (in relation to the others) that this means you should get ready to sell? And im really sorry but what do you mean that stiar is stopping on smaller breaks or pivot highs? That the stair are getting higher but on smaller consolidations channels? Sorry i really need to understand mroe of the lingo
Pro's do hundreds of contract at a clip unless it is a contract that can't handle size. I don't use candlesticks at all, when I started in 1978, I would draw my charts by hand, and never saw candles till late 80s I think.
<<That the stair are getting higher but on smaller consolidations channels? >>
YES, I don't see them as channels but breakage distance between one pivot high and next.
Hidden or Reverse divergence very easy to find. You are seeking higher oscillator reading but lower price lows compared to last pivot low in both Oscillator reading and price.
<<<MACD, Stochastic, William's %R, and RSI.>>> Using all these is like overkill, just look for smaller and smaller differences in pivot differences, just easier, I used indicators over 25 years, if you just starting out, trade with the trend for couple years first, but good to know when trend likely to end so you can stop taking trend trades and take profit.
Just remember every trade is a prediction or a gamble based on well back tested Trading Plan.
Im just trying to understand really well cuz professionals have told me that if you want to scalp and do intraday trading you really dont need a lot of Fundamentals but really you should focus on learning TA. And to me that kind of makes sense.
Every chartist goes through a stage where he tries to learn everything there is to know about technical analysis, so this is a good time to make a personal observation that can save you a lot of time and frustration and money.
Trading is a lot easier to learn on very short time frames because of the feedback. For example, you could read a 1000 books on investing and not read one word about money management. Charlatons can write books on investing, sometimes for decades, without being found out as snakeoil salesmen because the feedback is so slow. However, write a day trading book and anyone who knows anything about daytrading would see right trough you if you didn't know your stuff. You learn faster on lower time frames. The irony here, and the reason I'm telling you this, is the winner's circle gets a whole lot wider as you move up in time frames. On one extreme, Mom and pop can often make money with buy and hold, and on the other hand, smarter people than you or I, veritable geniuses, are regularly destroyed by scalping.
Presumably, you are interested in trading to make money, not primarily to be a scalper. Time frames don't matter, money matters. A lot of people have learned this lesson the hard way, suffering for years before they gave in and widened their holding time. If you don't mind, my advice to you as an aspiring trader is to learn everything you can about scalping, and then take those skills up to a higher time frame where the profits are easier to make and keep. Everybody has a best time frame, we just have to tinker until we find it.