
Here is the question that the programmer put to me, and asked me to define.....
" We'll certainly need something tractable to build out your wedge algorithm. I.E. How is the wedge determined? Is there something mathematical that we can use? Can you describe why something is a wedge and other patterns are not? "
So I need some input please , on how other traders would describe in worded context,
the definition of a Wedge pattern that occurs on a chart ( Time frame of the chart irrelevant )
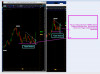
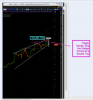
I am looking to have coded and developed ( Hopefully ) a system/strategy that will alert me to the Apex point for when a Wedge Pattern has developed AND a " Trigger " candle has formed and closed , right at the Apex of the Wedge ( Please see attached images that show these sort of wedge patterns WITH the trigger candle )
I define a Trigger candle , for a Long trade , as a Hammer candle or a full/big body Green candle, and for a Short trade, the Trigger candle at the Apex point of the wedge would be an Inverted hammer or a full/big body Red candle.
To me ,
a wedge is when there is a narrowing of a range in Price,
and that a " Strong " and reliable wedge occurs at New highs and at New Lows ,
as well as they occur at Strong Support levels ( Double, triple and Quadruple bottoms )
and at Strong Resistance levels ( Double, Triple and Quadruple tops )
Hopefully the attached charts will clarify what I am looking for
Thanks again for any and all help and input
" We'll certainly need something tractable to build out your wedge algorithm. I.E. How is the wedge determined? Is there something mathematical that we can use? Can you describe why something is a wedge and other patterns are not? "
So I need some input please , on how other traders would describe in worded context,
the definition of a Wedge pattern that occurs on a chart ( Time frame of the chart irrelevant )
I am looking to have coded and developed ( Hopefully ) a system/strategy that will alert me to the Apex point for when a Wedge Pattern has developed AND a " Trigger " candle has formed and closed , right at the Apex of the Wedge ( Please see attached images that show these sort of wedge patterns WITH the trigger candle )
I define a Trigger candle , for a Long trade , as a Hammer candle or a full/big body Green candle, and for a Short trade, the Trigger candle at the Apex point of the wedge would be an Inverted hammer or a full/big body Red candle.
To me ,
a wedge is when there is a narrowing of a range in Price,
and that a " Strong " and reliable wedge occurs at New highs and at New Lows ,
as well as they occur at Strong Support levels ( Double, triple and Quadruple bottoms )
and at Strong Resistance levels ( Double, Triple and Quadruple tops )
Hopefully the attached charts will clarify what I am looking for
Thanks again for any and all help and input
Attachments
-
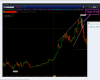 2015-07-26 18_13_00-2015-02-06 2 great setups on YELP weekly chart - Windows Photo Viewer.png48.4 KB · Views: 166
 -
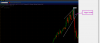 2015-07-26 18_15_06-Greenshot image editor.png67.9 KB · Views: 185
 -
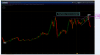 2015-07-26 18_16_08-2015-02-07 GREAR short on NOV via Monthly chart - Windows Photo Viewer.png142.3 KB · Views: 156
 -
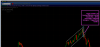 2015-07-26 18_19_48-2015-02-07 GREAT short on HOT via Monthly chart - Windows Photo Viewer.png71.9 KB · Views: 154
 -
 2015-08-10 AMZN setups on the weekly and monthly charts.png261.2 KB · Views: 173
 -
 2015-08-10 CMG setup on the weekly chart.png103.2 KB · Views: 140

