Why Sell Iron Butterfly trades?
Company Background and Key Events:
TRADE DETAILS OF THE WALT DISNEY COMPANY - DIS - IRON BUTTERFLY - JUNE 28 2019


- Iron butterflies are direction neutral and primarily a bet on the spread between the implied volatility versus the underlying stock volatility.
- Iron Butterfly trade ideas are based on selling straddles and buying strangles because historical probability distributions are easier to model (given enough analytical / computing horsepower) with a closer expiry date. Selling very far OTM Puts and calls are harder to model because of fat tail distributions (See Taleb commentary on selling tail options vs volatility in the body)
- For Iron Butterfly sellers, even if the underlying asset moves against you, the losses are limited and the premium collected could be justifiable from an expected value perspective.
- Expected values are generated using past historical stock volatility tables and computed using a cumulative probability density function at various potential stock changes.
- Executing an entire basket of Iron Butterfly trades may have a higher chance of success than executing any one single trade
- We calculate probabilities for all combinations of stock moves and time periods for every stock. For e.g. What is the probability of The Walt Disney Company (DIS) moving 10%/9%/8% etc for every period 7/8/15/30/31/32 day etc. This is a very computationally intensive process but far superior to an assumption of the curve of the stock patterns and then approximating that through standard deviation. Here is some background from Taleb on the challenges of using Standard Deviation for modeling.
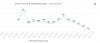
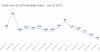
- Based on the probability tables for every single combination of stock move and period- we compute a cumulative probability density function for the various stock changes. That is in the 2nd chart you see below. For e.g. what is the probability of DIS closing above 6/7/8/8/10% etc in X days?
- Once we compute the density function- we then run the expected value for each point in the stock price and then sum up the expected value for the option seller
Company Background and Key Events:
- Company Background: The Walt Disney Company is an American diversified multinational mass media and entertainment conglomerate headquartered in Burbank, California, at the Walt Disney Studios. The company’s market cap is USD 254.93 Billion and has an annual revenue for the year 2019 being USD 59.76 Billion.
- Key Events: Earnings and other information: The Company’s Ex-Dividend date is 5 July 2019, and the estimated interim results of the company is expected on 5 August 2019.
TRADE DETAILS OF THE WALT DISNEY COMPANY - DIS - IRON BUTTERFLY - JUNE 28 2019
- Expiry Date of Options: Aug 9th 2019 (30 Trading Days)
- What is the trade?: Sell 140 Calls ($4.6) & Puts ($5.15) and Buy 125 Put ($0) and 155 Call ($0). (Note: The OTM Put & Call Price was zero on June 28th because those options were not traded and even offering a marginally higher price for those OTM strikes should not impact the expected value and ROI calculations by a substantial amount)
- Stock Price as of June 28 2019: 139.64
- What is the Net Option Premium / Max Profit to the Option Seller: $9.75
- What is the Maximum Loss to the Option Seller?: $5.25
- What is the expected value of the trade to the option seller based on probability calculations of past historical stock movements of the stock?: $3.08
- What is the ROI (Expected Value / Max Loss) to the Seller?: 58.75% ($3.08 / $5.25)
- How much should the Stock Move for the Option Seller to Start Losing Money? 7.2% (For Calls) and -6.7% (For Puts)
- How much should the Stock Move for Option Seller for the Max Loss ? 11% (For Calls) and -10.48% (For Puts)
- What is the Probability of the Trade Being Profitable for the Option Seller (Green Zone in Chart)?: 75.69%
- What is the Probability of the Trade Being Unprofitable for the Option Seller (Yellow + Pink Zone in Chart): 24.31%
- What is the Probability of a Maximum Max Loss for the Option Seller (Pink Zone in Chart): 11.75%
- What is the current (52 Week - High / Low) Implied Volatility for at the Money (ATM) Options? - 21% Current (14%- 52 Week Low & 37% - 52 Week High)
Last edited: