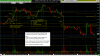
I actually only started getting consistent results when I came across Wyckoff and volume-based trading. I currently use a few tools which I combine to achieve my results: volume profile and volume at price, weis waves, money flow index (MFI) and obviously the volume bars. The idea is I analyze each candle (volume bar), price move (weis waves) and general movement (MFI), with regards to the distribution of volume within the day's range and the volatility threshold offered by Bollinger Bands -- which also are quite helpful in spotting accumulation or distribution (when price begins to concentrate in narrow range, i.e., the market's volatility is drastically reduced).
What I'll look for are signs of strength or weakness to the upside or downside. Particularly, when price interacts with the Bollinger bands, since it generally doesn't manage to move beyond them if there is no volume to back the move. In that sense, I just disregard the usual "oversold-overbought" rationale. If price makes it beyond the bands and I get, say, an overbought reading from MFI, that is actually telling me the move was strong and is likely to continue rather than reverse. A push beyond the bands with a low MFI reading tells the opposite: that price is unlikely to be able to continue in such direction. Additional volume and general analysis (say, knowing if price is moving towards accumulation or distribution) is then used to corroborate or invalidate this analysis.