Hello.
Is there a way to display volatility charts for a few forthcoming months, i.e. CLN6, CLQ6, CLU6 as example? Chart should be vol to time relation, i.e. vol values on Y and time values on X axis respectively.
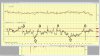
I have an example from Russian stock exchange platform (Quik), there're 2 charts of back and front months vol at the top, and special indicator of vol arb between them at the bottom.
That's the way I want to find it on CME products. I have IV/HV charts in my TOS platform, I have Quikstrike account, but that's not similar to that chart in attach. Any suggestions?
Is there a way to display volatility charts for a few forthcoming months, i.e. CLN6, CLQ6, CLU6 as example? Chart should be vol to time relation, i.e. vol values on Y and time values on X axis respectively.
I have an example from Russian stock exchange platform (Quik), there're 2 charts of back and front months vol at the top, and special indicator of vol arb between them at the bottom.
That's the way I want to find it on CME products. I have IV/HV charts in my TOS platform, I have Quikstrike account, but that's not similar to that chart in attach. Any suggestions?