As an example, we use APPLE stock price development.
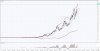
Screenshot 1
Technical analysis using an indicator
MACD
Bollinger bands
3 moving averages with different offset intervals
What is the information content of this type of technical analysis of the market?
The price is in the zone of the maximum reversal of the Bollinger band and is significantly higher than moving averages with different intervals of bias.
MACD entered the overbought zone.
Trader decisions
- wait for the entry point for the medium-term trend (rollback)
What exactly will happen in this case?
The price will “fulfill” the target, turn around, create an impulse, and only after that these indicators will begin to give a weak signal about the beginning of the rollback formation.
Given that the chart is in the interval of a week, a similar signal will take at least 6 weeks until the indicators can give a visual signal to the trader.
What exactly is the disadvantage of this method!
1 By the beginning of signal formation by indicators, the price will be able to make another short-term rollback from the medium-term trend, and thus your entry point will become irrelevant.
If a sharp rollback occurs, you will lose at least 50% of the upcoming movement
2 there is no specific purpose for the entry point to your deal
3 no landmark in the depth of the rollback
4 Indicators are lagging indicators and are able to exclusively duplicate the price structure of the current chart
Conclusion - why should a trader have a duplicate chart that actually does not carry any real information
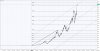
Screenshot 2
The basics of the simplest technical analysis using Fibonacci levels and price work in an equidistant channel
what do we see?
- the picture completely repeats the informativeness of the chart with indicators
The price worked the upper boundary of the channel and, in accordance with the Fibonacci level, the trader will have a target entry point at the level of 278.6.
the initial rollback level can be considered at the boundaries of 261.8 and 224 Fibonacci
Thus, unlike the indicator, the trader has the opportunity to navigate both entry points and exit points from the transaction.
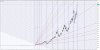
Screenshot 3
Gann simplest calculus
used
Fan gunn
Gann Grid
Fibonacci Time Zones
The action of the action within the boundaries of the next cell of the Gann grid coincides with the Fibonacci cycle and allows counting on a rollback to the border of the previous level of the Gann fan
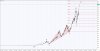
Screenshot 4
Gartley
triangles - Garley pattern “3 movements” and rollback in the form of an ABCD patent, where the level of 127.6 is the key, and from there you can consider the rollback to the Fibonacci level of 88.6
Dear demagogues, you can keep your opinion to yourself, it’s not interesting to me.
Question to those who are able to think with their head and not their ass
What is more acceptable for the Trader -
Indicators that really do not carry any information, or guidelines in accordance with the simplest application of technical analysis?
do not know how to use technical analysis - pay to those who teach you how to use it and your profit will increase significantly!
Screenshot 1
Technical analysis using an indicator
MACD
Bollinger bands
3 moving averages with different offset intervals
What is the information content of this type of technical analysis of the market?
The price is in the zone of the maximum reversal of the Bollinger band and is significantly higher than moving averages with different intervals of bias.
MACD entered the overbought zone.
Trader decisions
- wait for the entry point for the medium-term trend (rollback)
What exactly will happen in this case?
The price will “fulfill” the target, turn around, create an impulse, and only after that these indicators will begin to give a weak signal about the beginning of the rollback formation.
Given that the chart is in the interval of a week, a similar signal will take at least 6 weeks until the indicators can give a visual signal to the trader.
What exactly is the disadvantage of this method!
1 By the beginning of signal formation by indicators, the price will be able to make another short-term rollback from the medium-term trend, and thus your entry point will become irrelevant.
If a sharp rollback occurs, you will lose at least 50% of the upcoming movement
2 there is no specific purpose for the entry point to your deal
3 no landmark in the depth of the rollback
4 Indicators are lagging indicators and are able to exclusively duplicate the price structure of the current chart
Conclusion - why should a trader have a duplicate chart that actually does not carry any real information
Screenshot 2
The basics of the simplest technical analysis using Fibonacci levels and price work in an equidistant channel
what do we see?
- the picture completely repeats the informativeness of the chart with indicators
The price worked the upper boundary of the channel and, in accordance with the Fibonacci level, the trader will have a target entry point at the level of 278.6.
the initial rollback level can be considered at the boundaries of 261.8 and 224 Fibonacci
Thus, unlike the indicator, the trader has the opportunity to navigate both entry points and exit points from the transaction.
Screenshot 3
Gann simplest calculus
used
Fan gunn
Gann Grid
Fibonacci Time Zones
The action of the action within the boundaries of the next cell of the Gann grid coincides with the Fibonacci cycle and allows counting on a rollback to the border of the previous level of the Gann fan
Screenshot 4
Gartley
triangles - Garley pattern “3 movements” and rollback in the form of an ABCD patent, where the level of 127.6 is the key, and from there you can consider the rollback to the Fibonacci level of 88.6
Dear demagogues, you can keep your opinion to yourself, it’s not interesting to me.
Question to those who are able to think with their head and not their ass
What is more acceptable for the Trader -
Indicators that really do not carry any information, or guidelines in accordance with the simplest application of technical analysis?
do not know how to use technical analysis - pay to those who teach you how to use it and your profit will increase significantly!
Attachments
Last edited: