
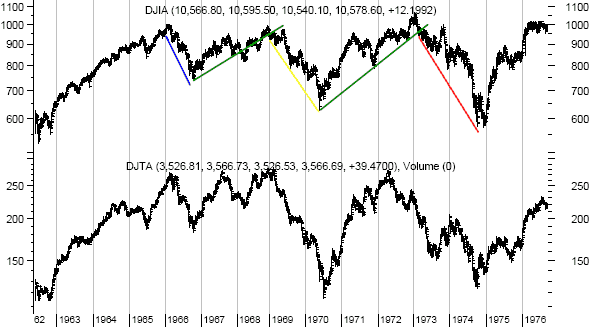
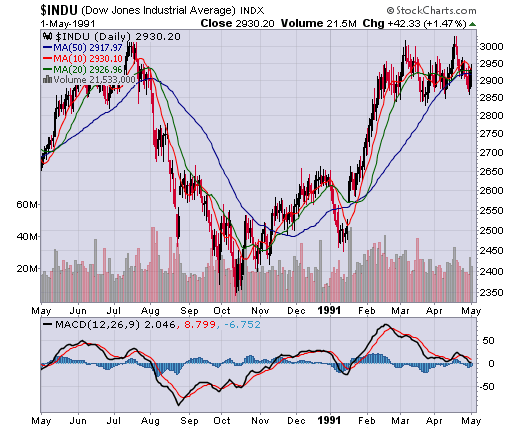
I will proceed to put the existing theories regarding energy levels to prove when the DJIA and SPOOZ can make v shaped bottoms as seen in 2003, 1991, and 1974.
Let us begin with a recap of the original thread:
http://elitetrader.com/vb/showthread.php?s=&threadid=156730
Generalized energy equation for a continuous function (price & volume):

Energy diagram:
http://s5.tinypic.com/11kz2mc.jpg
Let us now divide volume into individal trades. Assume that the total quantity of volume is divided into blocks.
And we'll assign an arbitrary negative left sided energy value to simulate a selloff. This energy is lost in a time interval, has a slope, and volume.
For a 'v' reversal, the conditions must satisfy:
the energy generated on the rebound must exceed or match the scalar of the energy lost on the selloff during the time interval the energy was lost.
We'll proceed to generate Gaussian distributions for the probability of this happening using the energy formula and volume blocks.
Let us begin with a recap of the original thread:
http://elitetrader.com/vb/showthread.php?s=&threadid=156730
Generalized energy equation for a continuous function (price & volume):
Energy diagram:
http://s5.tinypic.com/11kz2mc.jpg
Let us now divide volume into individal trades. Assume that the total quantity of volume is divided into blocks.
And we'll assign an arbitrary negative left sided energy value to simulate a selloff. This energy is lost in a time interval, has a slope, and volume.
For a 'v' reversal, the conditions must satisfy:
the energy generated on the rebound must exceed or match the scalar of the energy lost on the selloff during the time interval the energy was lost.
We'll proceed to generate Gaussian distributions for the probability of this happening using the energy formula and volume blocks.