What is this, a Medium.com dry run?
Advertising for his udemy course

What is this, a Medium.com dry run?
My experience has actually been okay with medium. Totally acknowledge that signal to noise is abysmal but sometimes it’s better to get something kinda right in broken English as a push in the right direction than to be completely stuck.What is this, a Medium.com dry run?
...and how 'bout a "And Good on 'im!"Advertising for his udemy course


...and how 'bout a "And Good on 'im!"
Jeez, guys -- how 'bout being happy for someone showing some umph?
My "Current Projects" list is about 6 months olde.
...and how 'bout a "And Good on 'im!"
Jeez, guys -- how 'bout being happy for someone showing some umph?
My "Current Projects" list is about 6 months olde.
Thanks for the suggestion of the caret package. In this strategy here, I only focus on predicting the next day's price direction and not the asset price itself. In other words whether the candle will be bullish or bearish, and then take an entry consequently.Trying to predict any type of asset price is not an ideal strategy. It is like predicting a random walk. You can clearly see that the data you are looking at is significantly long-biased. If you randomly make entry and exit trades, you can probably achieve close (if not greater) than the accuracy of 0.567 you achieved. Try to do it for a bunch of simulations. The same type of fallacy can be found when simulating random trades in the equity market since ~2008. People backtest a strategy with between 50-60% accuracy and then start a fund and trade only to realize that the market is also skewed the same way (long-biased 50-60%), erasing any profits.
Predicting asset prices is not a great way to go about automated trading. It is much more beneficial to try to optimize functions and algorithms as opposed to directly trying to predict something that is essentially random.
On a side note, if you want to play around with a bunch of models in R, I suggest using the caret package. It is really easy to use and has great functionality.
My problem is that I'm a total jerk.
 )
)What is this, a Medium.com dry run?
Thank you for sharing. May I ask you a couple of questions:In the past posts, I have mainly been talking about automated trading strategies based on simple logic, rule-based and technical analysis driven. In this post I want to share how we can use machine learning algorithms, particularly those that are suited for classification problems to predict the next day market direction. Yes, I mean only the next day price direction, and not the next month or next 6 months. The reason why I am focusing on such a small time horizon if because it should in theory be easier to predict the short-term, rather than the medium or long term.Let’s jump into it.
I will use light crude oil futures data. I have the data loaded from a csv file. The data contains, daily Open, high, low and close price of crude oil futures (CL on Nymex). I then format or change the dataframe into an xts (specific time series format) in order to plot it with a candlestick plotting function from the Quantmod package.
library(tidyverse)
library(lubridate)
library(quantmod)
library(ggplot2)
price <- read.csv("wtiDaily.csv")
setup_data <- function(pricedata) {
#Small function to format the data into xts format
names(pricedata) <- c("Date", "Open", "High", "Low", "Close")
dates <- parse_date_time(x = pricedata[,1], "mdy_HM", truncated = 3)
pricedata <- pricedata[,2:5]
pricedata <- xts(pricedata, order.by = dates)
}
price <- setup_data(price)
ema7 <- EMA(price$Close, n = 7)
ema20 <- EMA(price$Close, n = 20)
ema50 <- EMA(price$Close, n = 50)
ema70 <- EMA(price$Close, n = 70)
After having formatted the data, i use the function chartSeries to plot the data.
chartSeries(price, TA=NULL, subset = '2017-06::')
addEMA(n = 7,col = "orange")
addEMA(n = 20,col = "red"
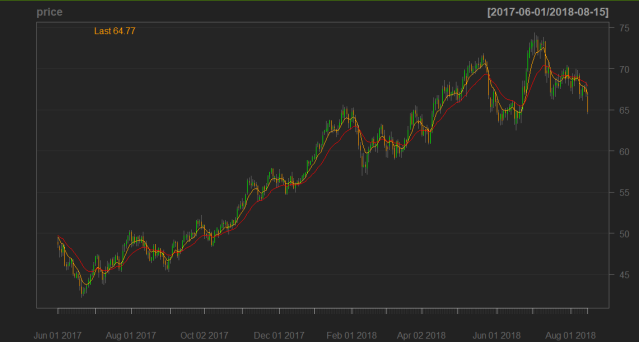
Now that i have the graph, i need to explain how i am planning to use machine learning predict the next day price direction. Another of saying this is also predicting the next day candle type. Since a daily bull/green candle is equivalent to price going higher on that day, and a bear/red candle is equivalent to price going lower on that day; It means i will be predicting whether the next day’s candle will be a bull or a bear candle. In order to do so, looking at the chart above, my hypothesis is if a use some variables as predictor variables or features in my machine learning algorithm, i should be able to predict fairly well the next day’s candle and therefore have an increasing equity curve. For variables or features, i will use the following:
#Defining the individual features/variables
- Close price in relation to exponential moving average of the last 7 periods
- today’s candle type (bull or bear)
- previous day’s candle type (bull or bear)
- daily return
candle.type.current <- data.frame(ifelse( price$Close > price$Open, "bull", "bear"))
candle.type.previous <- data.frame(lag(candle.type.current$Close, n = 1))
candle.next.day <- data.frame(lead(candle.type.current$Close, n = 1))
position.to.ema7 <- data.frame(ifelse(price$Close > ema7, "above", "below"))
dailywin <- data.frame(abs(price$Close - price$Open))
candle.nextday.win <- lead(dailywin$Close, 1)
#Making up the dataframe with all the features as columns
dailyprice <- data.frame(candle.type.current,candle.type.previous,
position.to.ema7, dailywin,
candle.nextday.win, candle.next.day)
# naming the dataframe columns
names(dailyprice) <- c("candle.type.current", "candle.type.previous",
"position.to.ema7", "dailywin",
"candle.nextday.win","candle.next.day")
#filtering out the data with NAs
dailyprice <- slice(dailyprice, 7:length(dailyprice$candle.type.previous))
After defining the features and i then go ahead and divide the data into train and test set. The data contains about 500 obversations (Trading days from June 2017 to August 2018). I use 300 data points as training set and the rest as test set. I also create a “formula”, specifying what is my target variable (what i am trying to predict) and the features.
#Splitting the data into training and testing
testRange <- 300:500
trainRange <- 1:300
test <- dailyprice[testRange,]
train <- dailyprice[trainRange,]
#Defining the formula: Target variables and predictors
target <- "candle.next.day"
predictors.variable <- c("candle.type.current", "candle.type.previous",
"position.to.ema7", "dailywin")
predictors <- paste(predictors.variable, collapse = "+")
formula <- as.formula(paste(target, "~", predictors, sep = ""))
#function for processing predictions
predictedReturn <- function(df, pred){
df$pred <- pred
df$prediReturn <- ifelse(df$candle.next.day != df$pred, -df$candle.nextday.win, df$candle.nextday.win)
df$cumReturn <- cumsum(df$prediReturn)
return(df)
}
Now let’s go ahead and train our machine learning model. Here i train a naive bayes algorithm (Learn more about Naive Bayes ).
library(naivebayes)
# Naivebayes model
nb <- naive_bayes(formula, data = train)
plot(nb)
# Prediction
nb.pred <- predict(nb, test)
nb.test <- predictedReturn(test, nb.pred)
#Plotting the net daily returns and cumulative returns
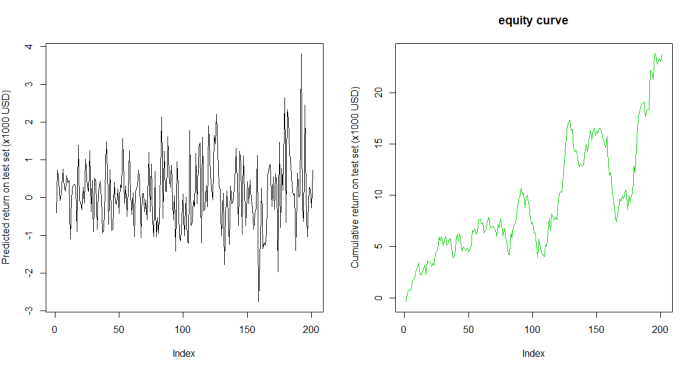
plot(nb.test$prediReturn, type = "line")
plot(nb.test$cumReturn, type = "line")
#Confusion matrix
confusionMatrix.nb <- table(nb.test$candle.next.day, nb.test$pred)
print(confusionMatrix.nb)
#Calculating accuracy
nb.misclserror <- mean(nb.test$candle.next.day != nb.test$pred)
print(paste("Accuracy", 1-nb.misclserror))
So the model evaluation on the test set is not dissapointing. It returns an accuracy of 57% which although it might seem low, is not a bad result in the trading arena, for such a limited amount of data. Obvisouly, more validation tests should be performed by changing the training and test window, carry out more serious cross validation and idealy use more data. Nevertheless, the equity curve looks interesting it is going higher (moneyyyyyy). We should not understimate the magnitude of the drawdowns, but i can say it looks good.
bear bull
bear 24 59
bull 28 90
[1] "Accuracy 0.567
I explain in more details how to add more features and also test other classification-based machine learning algorithms to predict next day’s price on Udemy. I felt i needed to create a course to share this knowledge and help others create their own trading strategies using machine learning with R.
is just a set of "rules"?i will use the following:
- Close price in relation to exponential moving average of the last 7 periods
- today’s candle type (bull or bear)
- previous day’s candle type (bull or bear)
- daily return
is the learning algorithm? It is just Bayesian statistics. So you apply a probability to the parameters you use? This is no different from say using Kalman filter algorithm, I don't see any "learning" involved.Now let’s go ahead and train our machine learning model. Here i train a naive bayes algorithm (Learn more about Naive Bayes ).
You should have no problem finding them on ET.Though I would say that being positive and encouraging while maintaining high standards is the best of all things.
My problem is that I'm a total jerk. I so often have to sit and just think about the ways I'm a jerk and then try to imagine being different. The only solution I can find is to go find people who are bigger jerks than me.


