
US Treasury Notes

Here is a better pic to illustrate my perplexity. Basically, the US-Treasury 10Y Note, this worthless piece of junk, has been going down non-stop for basically 40 years. Much more than my entire career. As surely as Warren Buffett traded the stock market, I trade the US T-Notes.

What are the mechanics behind this mother of all bears? To what strong economic laws does it obey? I'd like to understand this.

You know there is a difference between the yield and the price of the 10 years ? Your chart is showing the yield over the years.
It shows the yield rising steadily through the 60s and 70s, then peaking in the 80s during the crazy savings and loans crisis. Inflation rate and interest rates went through the roof during that period in the 80s, it was the time when interest rate products were the king, equities were just the underdog back then. Pit traders like Tom Baldwin and Charly di Francesca made a fortune trading in the CBOT bond pits.
After that peak the yields have been going down for decades, the downtrend you mentioned. Leaving the financial crisis of 2008 behind us we are slowly seeing the yields to come back up, but more in the US, not in the EU so far.
If you want to trade cycles like these, or even grab parts of these cycles, based on fundamental analysis, you will need the mother of patience and carloads of risk capital per contract.
There is so much volatility and movement there every single day, in interest rate futures and even more in other contracts. If you are an institutional trader/ organization that needs to move big big size, I understand that one cannot scalp for short moves like that. But if you are an individual investor/ trader, then there is so much more than these big slow fundamental cycles, so much inefficiency to exploit every day, situations that are much easier to take advantage of as a small trader, with a limited contract size.
You say you are an analytical numbers guy, so the opportunites that present themself everyday should feel like paradise to you. Limit your risk, limit your exposure to the market, but dont limit yourself in your trading.
 
Last edited:
I focus on technicals too. I'm an engineer in Computer Sciences, with a M.A.Sc. in Artificial Intelligence. I know nothing about economics. So basically my opinion about economic fundamentals has the same value as Trump's opinion about Global Warming.

I'm very happy with the shorting so far. Small range is not a problem for my systems, since they adjust their leverage proportionally to the volatility of an asset. So T-Notes have small volatility, but my systems trade them using more leverage than say, for the EUR/USD.
you are on a dangerous path Neuro. Have you heard about the vix blow up a few months ago ?
 
You know there is a difference between the yield and the price of the 10 years ? Your chart is showing the yield over the years.
It shows the yield rising steadily through the 60s and 70s, then peaking in the 80s during the crazy savings and loans crisis. Inflation rate and interest rates went through the roof during that period in the 80s, it was the time when interest rate products were the king, equities were just the underdog back then. Pit traders like Tom Baldwin and Charly di Francesca made a fortune trading in the CBOT bond pits.
After that peak the yields have been going down for decades, the downtrend you mentioned. Leaving the financial crisis of 2008 behind us we are slowly seeing the yields to come back up, but more in the US, not in the EU so far.
If you want to trade cycles like these, or even grab parts of these cycles, based on fundamental analysis, you will need the mother of patience and carloads of risk capital per contract.
There is so much volatility and movement there every single day, in interest rate futures and even more in other contracts. If you are an institutional trader/ organization that needs to move big big size, I understand that one cannot scalp for short moves like that. But if you are an individual investor/ trader, then there is so much more than these big slow fundamental cycles, so much inefficiency to exploit every day, situations that are much easier to take advantage of as a small trader, with a limited contract size.
You say you are an analytical numbers guy, so the opportunites that present themself everyday should feel like paradise to you. Limit your risk, limit your exposure to the market, but dont limit yourself in your trading.
ha this is funny Neuro you clearly have no clue what you are doing
 
I focus on technicals too. I'm an engineer in Computer Sciences, with a M.A.Sc. in Artificial Intelligence. I know nothing about economics. So basically my opinion about economic fundamentals has the same value as Trump's opinion about Global Warming.

I'm very happy with the shorting so far. Small range is not a problem for my systems, since they adjust their leverage proportionally to the volatility of an asset. So T-Notes have small volatility, but my systems trade them using more leverage than say, for the EUR/USD.
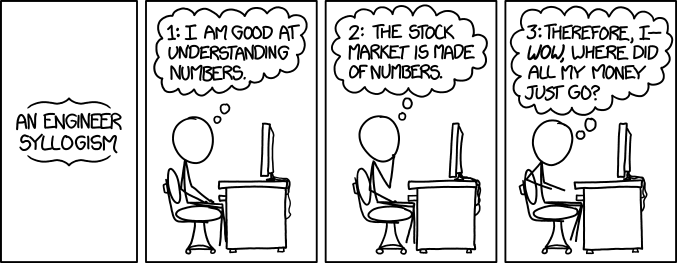
Why in the heck would one trade something that they admit (and clearly in fact do) know nothing about! I'm guessing you haven't seen my favorite cartoon on the subject of this type of outlook:
engineer_syllogism.png

https://xkcd.com/1570/
 
Hi folks,

I am a trader by trade. A scientist working with facts, numbers and statistics. Not beliefs, crystal balls, feelings or uneducated opinions. I don't predict the markets. I trade them just like I play chess.

Enough about myself. I have been trading US T-Notes for years and I notice that they always go down, down, down and even more low. They seem to be headed to $0. Never up. Unlike the German Bund or whatever governement issued paper in Europe and the rest of the world.

Yes, of course, they are not a bad thing to trade. For the bears, on the short side.

But why are they such a piece of junk? I mean, why are they so bearish? Isn't the US economy supposed to be good? Shouldn't that have, as a consequence, a positive effect on its government-issued papers?

I have never seen such a crappy, bearish asset in my whole life, except perhaps TRMP, the Trump-owned stock, which went from $34 to $0 in less than 10 years.

So my questions, again:

1) Why are US T-Notes so bearish?

2) Why is such a "strong" US economy affecting the T-Notes in such a negative way?

Thanks,

N.

I think they are making the cost of borrowing cheaper to support the level of demand in the economy. A lower rate of return usually means a lower cost of lending and encourages borrowing, this may have been made necessary by the high levels of tax requiring monetary policy to be eased to hit money circulation targets. A must in a highly geared economy.
 
Here is a better pic to illustrate my perplexity. Basically, the US-Treasury 10Y Note, this worthless piece of junk, has been going down non-stop for basically 40 years. Much more than my entire career. As surely as Warren Buffett traded the stock market, I trade the US T-Notes.

What are the mechanics behind this mother of all bears? To what strong economic laws does it obey? I'd like to understand this.
I am no economist nor scientist just a retail trader not knowing much but reading your post and looking at your chart, I am puzzled.

The chart you posted here is the 10 yr treasury note yield curve? If you bought bond fund tied to this "worthless piece of junk" starting 1980 you should do well?

But today I take my money and run.

For your reference, here is another "worthless piece of junk" 10 year treasury note yield curve:
upload_2018-11-28_14-27-5.png

Canadian dollar.
 
I focus on technicals too. I'm an engineer in Computer Sciences, with a M.A.Sc. in Artificial Intelligence. I know nothing about economics. So basically my opinion about economic fundamentals has the same value as Trump's opinion about Global Warming.

I'm very happy with the shorting so far. Small range is not a problem for my systems, since they adjust their leverage proportionally to the volatility of an asset. So T-Notes have small volatility, but my systems trade them using more leverage than say, for the EUR/USD.


Ha! Me too. I graduated in engineering.
But I know nothing about those fundamentals.

One thing good about trading is Not to know too much.
The more we know, the more money we lose.

The chart provides all the necessary information for us to pull the trigger.
 
Here is a better pic to illustrate my perplexity. Basically, the US-Treasury 10Y Note, this worthless piece of junk, has been going down non-stop for basically 40 years. Much more than my entire career. As surely as Warren Buffett traded the stock market, I trade the US T-Notes.

What are the mechanics behind this mother of all bears? To what strong economic laws does it obey? I'd like to understand this.

lol "worthless piece of junk".
If it is truly worthless piece of junk it would be trading at 10% or 20%, not 3%
It is just the end of a long and huge bull run until recently.
 
engineer_syllogism.png


or should it be this ?

1. I am good at understanding simple numbers & plus and minus.
I don't understand those complex Navier Stokes equations,
Euler Product formula or Pythagorean theorem.

2. The stock market is made of simple numbers.
3. WOW !! So much money falls from the sky.
 
Last edited:
Back
Top