Understanding price action

  • Thread starter Thread starter Erin
  • Start date Start date
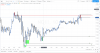
Price Action Tripple Top
on NQ 10m, June 18

http://thepatternsite.com/tt.html
https://www.investopedia.com/terms/t/tripletop.asp
pa double top tripple top.jpg
 
10 min - sorry I missed your post this is how I would see such a small timeframe
Where would you say that entries would occur with this method on this chart, maybe illustrated with arrows to the spots?
 
Actually this is really interesting...can I ask you a question...do you understand what you are looking at and what is making it move... more to the point - what makes price move - for simplicity to your links - yes beginners start here. However it is one sided. You see the patterns but it does not show how or why price evolves through price action. Give me your present idea on it - I would like to participate
 
Where would you say that entries would occur with this method on this chart, maybe illustrated with arrows to the spots?
I also missed the 30 second chart you are trading on...can I ask why you trade on such a low time frame
 
Back
Top