You are using an out of date browser. It may not display this or other websites correctly.
You should upgrade or use an alternative browser.
You should upgrade or use an alternative browser.
Every bar has buy and sell pressures within it’s confines. Every bar is made up of actual orders executed so order flow can be examined within bars. Every bar tells a story. There is no such thing as noise in the markets. That concept is a myth invented..hung onto ...and propagated by traders that get whipsawed around, as they try to explain what has happened to them.
ROFLMAO mickey drink some more coffee...puleezeView attachment 225974
Technical analysis via chart reading LOL
Last edited:
Good for you. You have figured out how to trade using an exact science to measure uncertainty and to measure a process that has variables in it, as well as unknowable variables! The best your mathematical models can do is point out tendencies ...just like we are doing with chart analysis. Listen up! Price is the same. Has been for over 100 years. There are trends, BO’s, PB’s, Channels, Ranges, Spikes, Triangles (varieties), Wedges, Head and Shoulders, Flags, Pennants, trends within ranges, channels within channels, wedges in ranges..wedges in channels...AS A MATTER OF FACT PRICE IS ALWAYS IN A CHANNEL.100% incorrect!
The majority of my price action analysis is done off a mathmatical model, ZERO CHARTS!
Your way of doing it ....well you may explain it by math alone...our way is by graphics and mathematical tendencies so we got YOU beat two to your one!
PS...I have yet to see any of your mathematical models. Give a few explanations. Don’t say it will be giving up your secrets LOL.
How well is math working on the Q? Might want to ask Dozzy!
Last edited:
Verification will undoubtably be asked for next..LolPrice action can be explained either via hindsight charts or real-time via live screen sharing of live streaming data. Both are fine but hindsight charts allow more in-depth explanations without the rush to keep it extremely simple when trying to do it in real-time via live data.
In my opinion, a combination of both is better and only a few ET members have done such but they're long gone from this place.
Yet, didn't see anyone in this thread asking for verification but there was just one person asking if these are trades.
wrbtrader
Every bar tells a story.
Ya, every bar has a story, every person has a story, can you hear yourself think for the noise? What stories do you believe or not believe? Have you time to understand the story? How relevant is the story? What is a story - it's an opinion! Can you make money from a story?
'Every bar tells a story' is just mind clutter and is highly likely to be infactual.
E
Erin
Ok - if your mind is totally closed to how price moves with buy and sell orders you should probably not be here - being the loudest in the room does not make your views better or less. These threads are only viable when the conversation is constructive. Let me go back and see if I can explain this alittle better. Here is a chart of how price action broke down and why it broke down and return of price back to the sell orders. Next Ill see if I can get some light housekeeping on the thread
Attachments
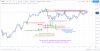
Ok - if your mind is totally closed to how price moves with buy and sell orders you should probably not be here - being the loudest in the room does not make your views better or less. These threads are only viable when the conversation is constructive. Let me go back and see if I can explain this alittle better. Here is a chart of how price action broke down and why it broke down and return of price back to the sell orders. Next Ill see if I can get some light housekeeping on the thread
as mentioned, you need to
target minimum reward : risk ratio of 3:1 or better.
if you target RR ratio of 1:1, your success rate must be very high like > 75%.
some people call that guerrilla tactic where you attempt to earn 10 pips for 10 pips risk.
and some book traders ( they look at ladder, not chart) do that.
In theory, your concept will work.
Unfortunately the example you gave AUDUSD has very small range.
So in real life, your concept wouldn't work.
Go try using real money to trade and see if you can earn money.