Hi,
Generally, it looks like RED is showing a value decrease and GREEN is showing a value increase for a security on TWS > Monitor > Favorites window but I am puzzled by some colors I see.
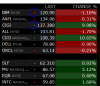
CHANGE% column which shows percentage change since last reset (end of day for example) shows RED if a security or forex has gone down since. Why wouldn't LAST column also show RED in this case? Below is a picture showing LAST column in various opposite states:
A) LAST is black / CHANGE % is RED (rows 1, 2)
B) LAST is red / CHANGE % is GREEN (rows 3, 4, 5)
C) LAST is black / CHANGE % is GREEN (rows 6, 8, 9)
And then we have good one like:
LAST is GREEN / CHANGE % is GREEN (row 7)
or
LAST is GRED / CHANGE % is RED (not shown in this picture but happens)
What do these colors in LAST mean? Why the discrepancy?

Generally, it looks like RED is showing a value decrease and GREEN is showing a value increase for a security on TWS > Monitor > Favorites window but I am puzzled by some colors I see.
CHANGE% column which shows percentage change since last reset (end of day for example) shows RED if a security or forex has gone down since. Why wouldn't LAST column also show RED in this case? Below is a picture showing LAST column in various opposite states:
A) LAST is black / CHANGE % is RED (rows 1, 2)
B) LAST is red / CHANGE % is GREEN (rows 3, 4, 5)
C) LAST is black / CHANGE % is GREEN (rows 6, 8, 9)
And then we have good one like:
LAST is GREEN / CHANGE % is GREEN (row 7)
or
LAST is GRED / CHANGE % is RED (not shown in this picture but happens)
What do these colors in LAST mean? Why the discrepancy?