Interesting read:
The Short Squeeze of The Decade?
Tesla has appreciated considerably since it IPOed nearly 10 years ago. In fact, Tesla has been one of the best-performing stocks over the last decade, appreciating by roughly 3,300% since it went public at around $17 a share. However, this has not stopped non-believers and short sellers from taking a very active role in shorting its shares.
In fact, Tesla’s short interest has continuously been around 20% or so throughout its history as a public company. Despite the recent surge in share price Tesla is the most heavily-shorted company in the U.S. (dollar wise), with a
short interest of around $14.5 billion. At the end of 2019 short interest share wise was about
26.26 million shares, which is roughly $15.3 billion going by Tesla’s latest share price of around $575. This is roughly 15% of all shares outstanding, but short interest was much higher before.
What appears to be a recent peak, on May 31, 2019, there were more than 43.66 million shares sold short. This was around 25% of all shares outstanding, and since then we’ve seen a steady decline in the number of short positions in the company. In fact, the number of shares sold short decreased by 40% from late May to early 2020. This is a very considerable amount and is likely exacerbating the perpetual move higher as more and more short sellers are forced to cover as Tesla’s stock continues to appreciate significantly.
So, Why Is the Stock Going Higher and Higher?
I mentioned the upgrades and the apparent short squeeze that's exacerbating the move higher. However, there are numerous elements in play here. Let’s look at some of the key factors responsible for the upgrades, the short covering, and the overall renewed interest in Tesla’s stock.
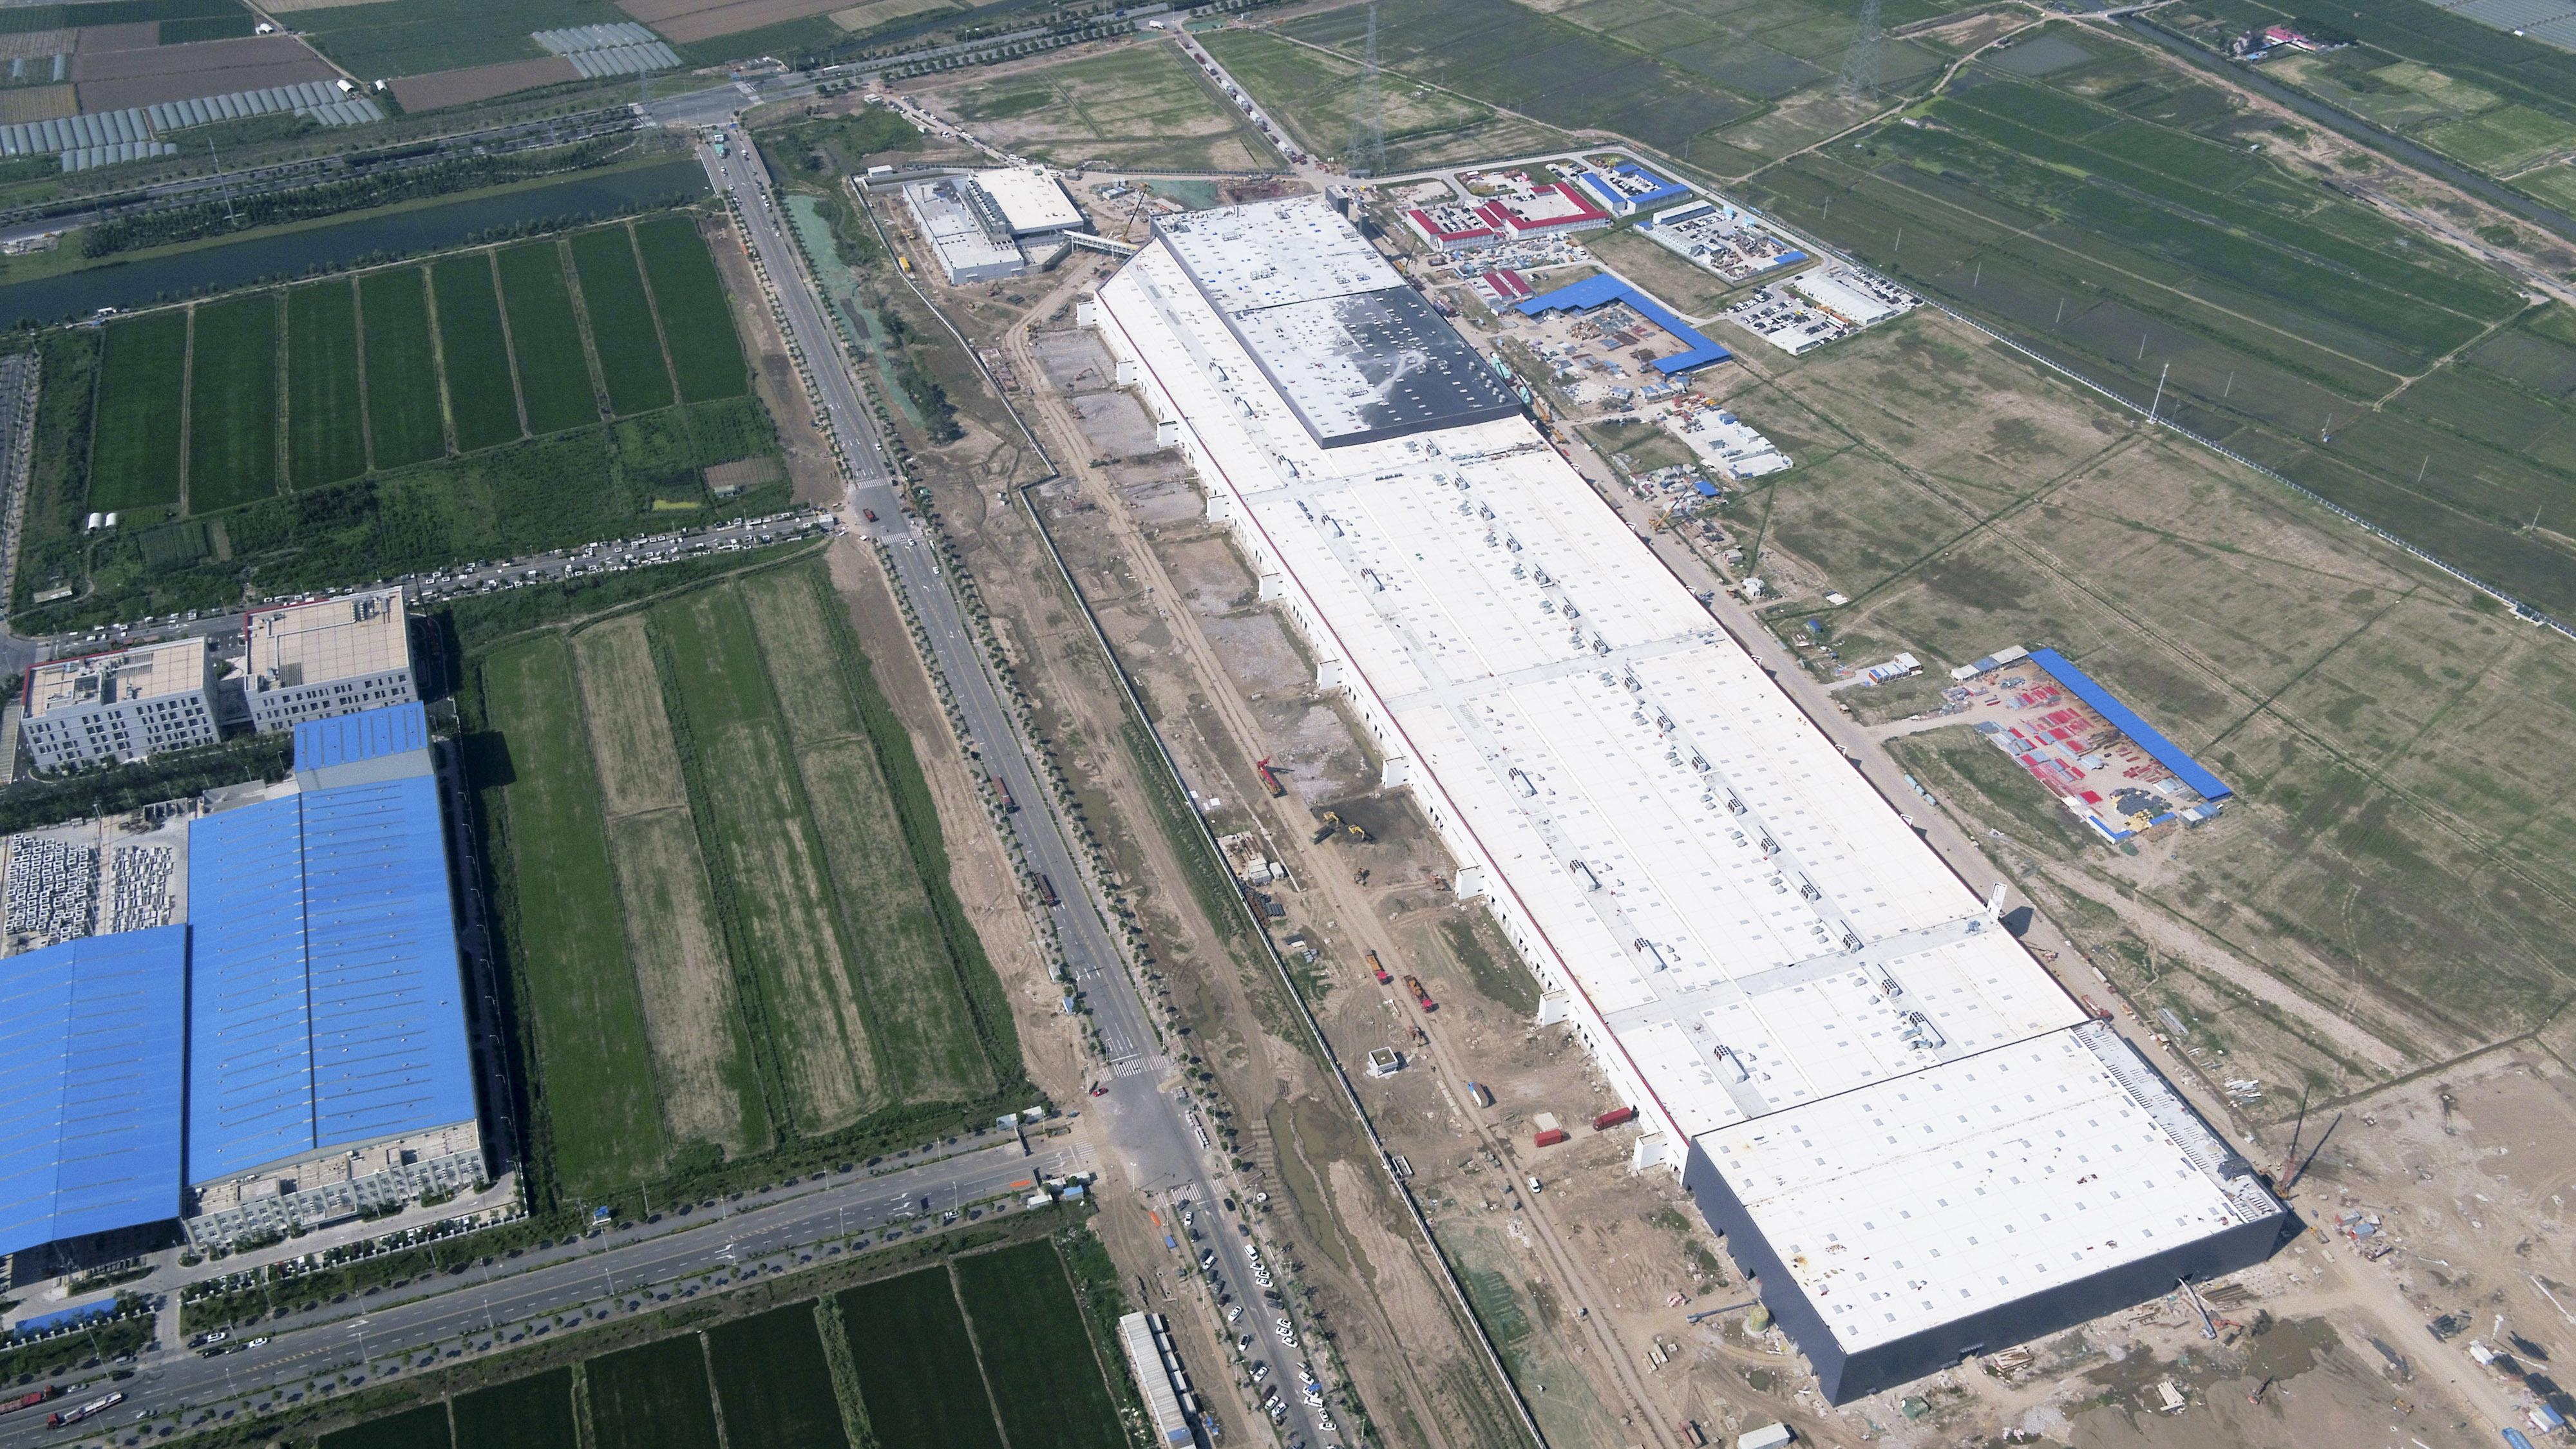
The Chinese Gigafactory
People said that it was a fairy tale, not possible to get an automotive factory up and running within a year. However, and despite the initial skepticism, the Shanghai Gigafactory appears to be a great success. Moreover, the Gigafactory in Shanghai has been a remarkable construction marvel as in just around a year the factory went from zero to now
rolling out Model 3s across China.
 Image Source
Additionally, the factory is expected to eventually
produce Model Ys as well. The Gigafactory in China is expected to produce roughly
500,000 vehicles annually when production reaches full capacity in future years. This should enable Tesla to greatly improve its supply chain capabilities, increase operational efficiency, raise overall profitability, and essentially flood the Asian market with its vehicles.
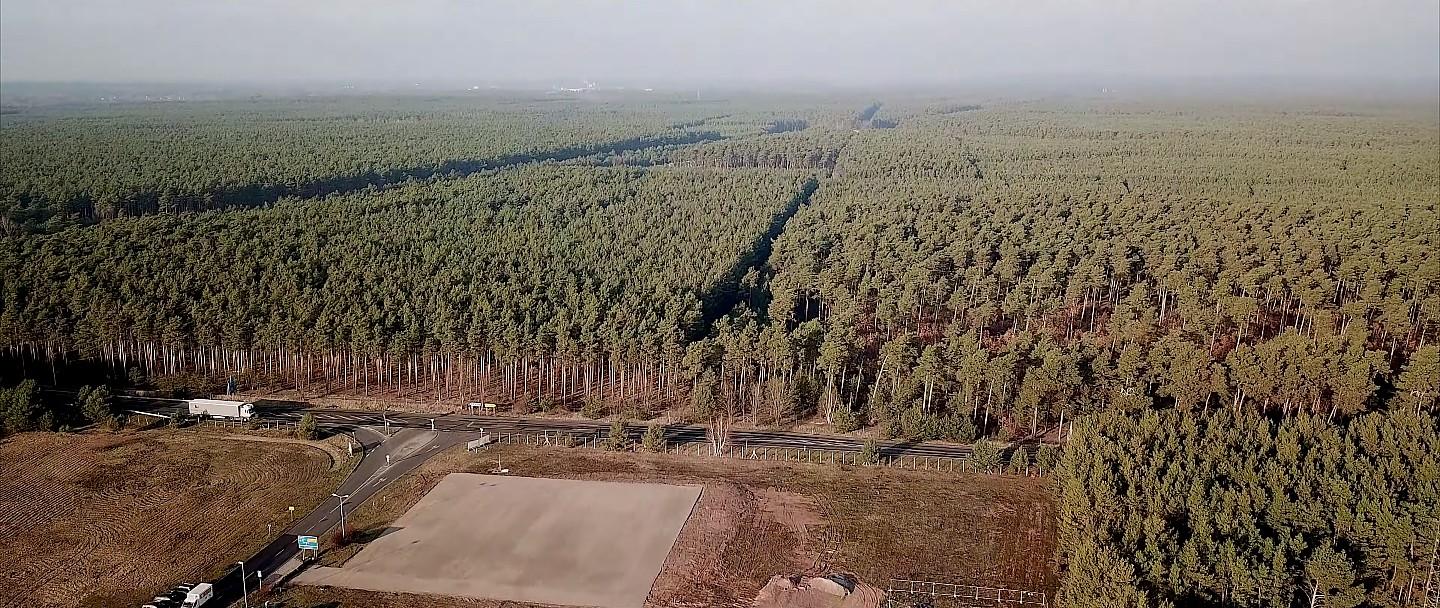
A Logical Step: The Next Gigafactory
Tesla is not wasting any time as it's already making plans to start
production on its next Gigafactory. In fact, Tesla has reportedly
acquired a 300-hectare property in Germany where the giant European-focused Gigafactory will be built. Construction is expected to start in 2020 and end in 2021. Judging by the record time Tesla brought its Chinese Gigafactory online, the company’s plans for Germany seem completely plausible. This factory also is expected to produce around 500,000 vehicles annually at full capacity. It appears that its main production goals will be Model Y and Model 3 vehicles for the European market.
 Image Source
Much like its factory in China, the European Gigafactory should allow Tesla to improve its supply chain efficiency and should enable the average selling price ASP for its vehicles to decline across Europe. This should spark more demand for Tesla’s vehicles and make them more competitive relative to their European counterparts.
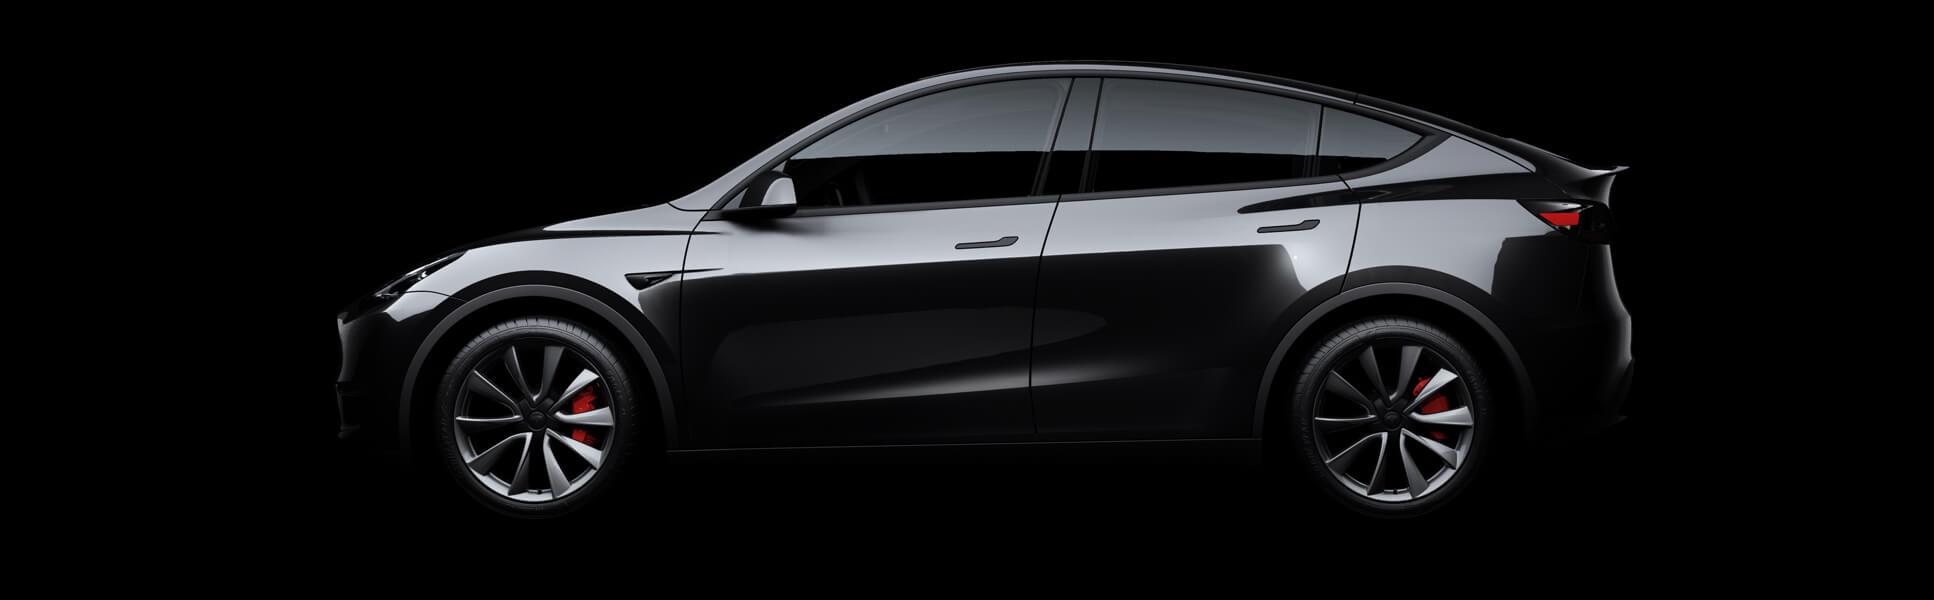
The Model Y Prospects
Model Y production is scheduled to begin in 2020 and the vehicle should be available sometime in the summer of 2020. This is a crossover vehicle that shares many of the same parts with the Model 3. This implies that it will likely be extremely profitable, relatively easy to produce in large scale, and could be enormously popular.
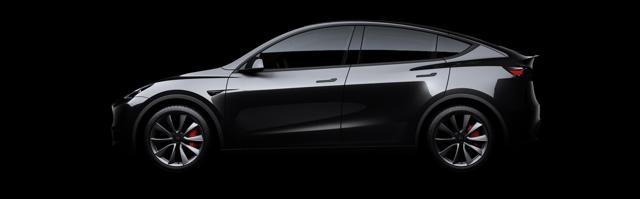 Source: Tesla.com
The consensus now is that the
vehicle will be constructed at Tesla’s Fremont factory as well as at Tesla’s factory in Shanghai. Company insiders, including Elon Musk, also have expressed that due to the popularity of the crossover vehicle across the globe, the Model Y is likely to experience substantially higher demand than the Model 3 vehicle, perhaps double.
Demand Remains Extremely Robust
Despite a relatively slow start in 2019, demand for Tesla vehicles appears to be extremely robust as the company met its target for the year delivering around
367,500 total vehicles, about a 50% YoY increase. In fact, Tesla’s Model 3 vehicle sales
were almost triple the number two electric vehicle’s global sales in 2019.
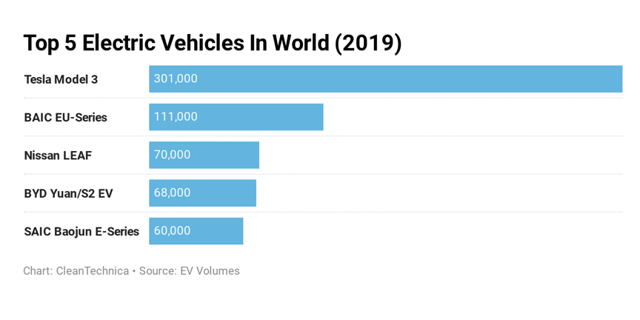 Source: CleanTechnica.com
Q4 Deliveries Breakdown
Source: CleanTechnica.com
Q4 Deliveries Breakdown
Tesla achieved a record number of deliveries in Q4, driving roughly
112,000 Tesla vehicles to its customers. This represented about a 23.5% YoY increase from the
90,700 number of vehicles Tesla delivered in Q4 2018.
As far as sales vs lease vehicles, about 14% of Model S/X vehicles delivered in Q4 were subject to lease accounting, and roughly 7% of Model 3s were lease models as well. Thus, out of the 19,450 Model S/X vehicles Tesla delivered it sold around 16,727 cars. Also, out of the 92,550 Model 3s Tesla delivered about 86,072 vehicles were sales. This implies that around 6,478 Model 3 vehicles, and roughly 2,723 Model S/X vehicles were new leases in the quarter.
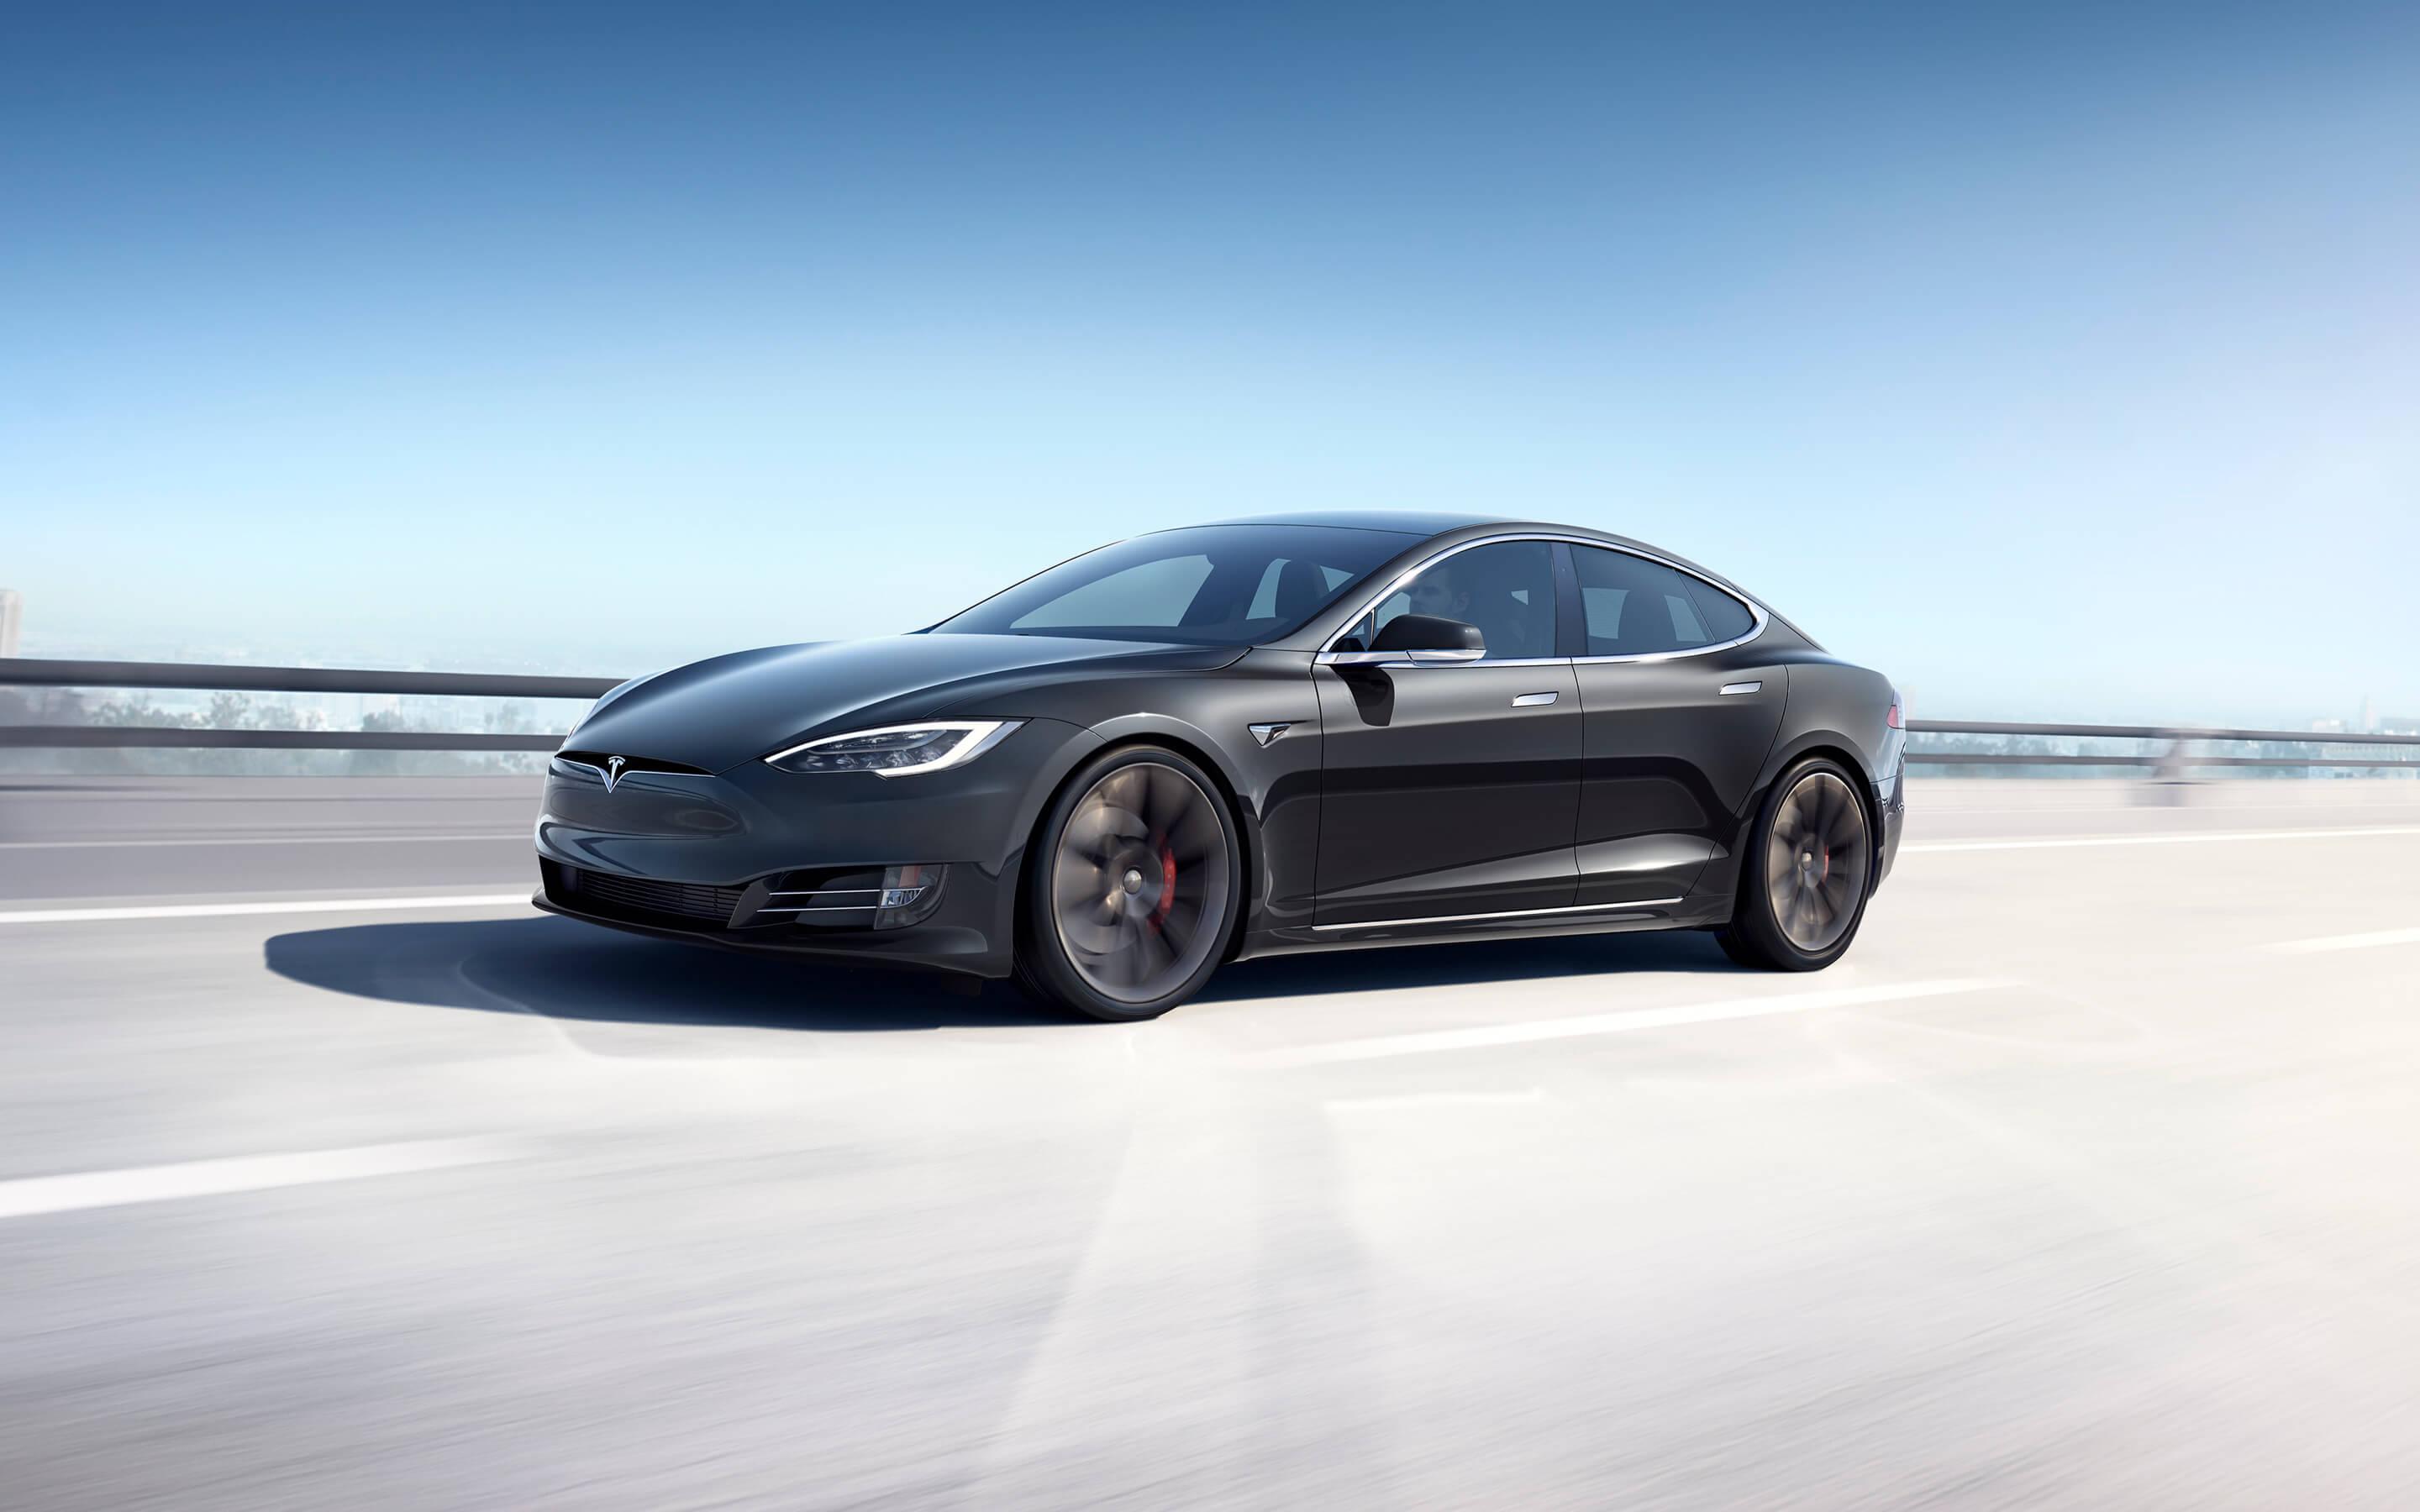
Model S/X ASPs
As far as pricing goes, we know that in the U.S. the
Long-Range Model S starts at about $80K, and the performance Model starts at roughly $100K. However, once we include options such as autopilot/full self-driving, premium color, interior, wheels, etc. The price of the Model S in the U.S. can quickly rise to around $95K-$115K. Therefore, the average selling price for a Model S vehicle in the U.S. is likely around $97.5K.
The base Model X vehicles are essentially $5K more expensive, as the Long-Range Model Starts at $85K, and the Performance Model starts at around $105K. Likewise, once premium options are included the price can rise to about
$108-$128.5K in the U.S. Thus, the ASP for a Model X vehicle in the U.S is likely around $107K.
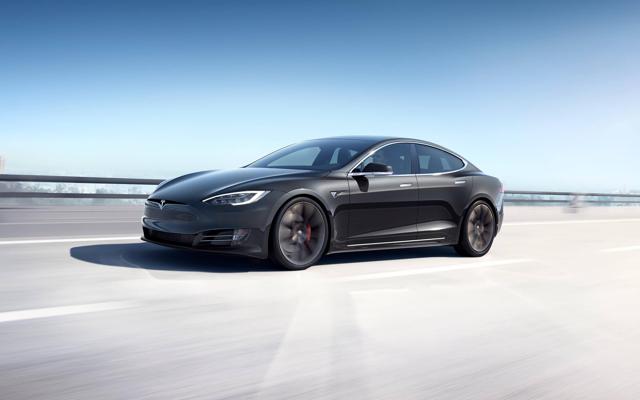 Source: Tesla.com
However, Tesla vehicles are not only sold in the U.S. In fact, the cars are quite popular in Europe, China, as well as in other parts of the world. For instance, we know that Tesla has been selling
roughly 30% of its vehicles in Europe in recent years. Additionally, Tesla’s sales in China are surging. Tesla’s sales in China soared by 161% YoY to
42,715 vehicles in 2019. This is nearly 12% of total Tesla sales.
Based on this data, we can presume that Tesla derived roughly 60% of its sales from the U.S./ North America, about 28% from Europe, and approximately 12% from China last year. Now, if we look at Model S/X prices in other regions, we can see that the ASP goes up substantially. For instance, a fully loaded Model S can sell for nearly $150K in China, and a bare base Model goes for roughly $115K. Thus, the ASP for a Tesla Model S vehicle in China is likely around $132.5K. Similarly, the Model X starts at around
$117.4K in China and can cost up to
$162.6K when fully loaded. Therefore, the ASP for a Model X vehicle in China could be around $140K.
European Model S/X models also are notably more expensive than their U.S. counterparts. For example, in Germany the Model S starts at around $96,348, and a nicely equipped version can
go up to around $136K. In England, the Model S
starts at around $101,787, and a fully equipped version will set consumers back by around $141,336. Therefore, the ASP for a Model S vehicle in Europe is likely around $118.75K
The Model X starts at over
$108K in Britain, and can go up to roughly $156K in price. Likewise, in Germany and in other European countries the X vehicle is notably more expensive than it is in the U.S. and so is its ASP. In France, the Model X sells for a similar figure, going up to roughly $155K for a fully loaded version, and starting at around $107.3K. In Italy, the vehicle starts at around $105K. In Germany, the X starts at around 102K but can go up to over $150K once loaded with premiums. Thus, the ASP for a Model X vehicle in Europe is likely around $130K.
Now, the
Model 3 starts at around $40,000 in the U.S. Yet, we can see that number increase to roughly $67K when fully loaded. Therefore, the ASP in the U.S. is likely around $50K for the Model 3. In Europe, the Model 3
starts at around $50K, but can quickly increase in price to about $83K or more, depending on the country. Therefore, the Model 3’s ASP in Europe is likely at least $60K. In China, the
Model 3 starts at around $43.3K, but once loaded can increase to about $84.5K. Thus, the Model 3’s ASP in China is likely around $55K or more in my view.
So, what are the ASPs for Tesla vehicles?
U.S.:
- Model S ASP: $97.5K
- Model X ASP: $107K
- Model 3 ASP: $50K
Europe:
- Model S ASP: $118.75K
- Model X ASP: $130K
- Model 3 ASP: $60K
China:
- Model S ASP: $132.5K
- Model X ASP: $140K
- Model 3 ASP: $55K(my estimates)
So, what are Tesla’s Total Automotive Sales in Q4?
If we presume that the 60%, 28%, 12% rule is about accurate, we can presume that Tesla derived roughly 60% of its sales from North America (mostly the U.S.), about 28% from Europe, and roughly 12% from China.
Also, we can presume that Tesla’s Model S/X sales breakup is about 45/55, roughly consistent
with previous quarters and logical since some Model S sales are likely being slightly cannibalized by the Model 3.
So, out of the 16,727 total Model S/X vehicles sold in Q4 likely around 9,200 were Model X vehicles and about 7,527 were Model S vehicles. Also, we know that Tesla sold roughly 86,072 Model 3s in Q4.
This implies that by region Tesla sold and recorder revenues of:
U.S./North America - 60%
- Model S: 4,516 units X $97.5K ASP = $440.31 million
- Model 3: 51,643 units X $50K ASP = $2.58215 billion
- Model X: 5,520 units X $107K ASP = $590.64 million
Total Sales: $3.613 billion
Europe - 28%
- Model S: 2,108 units X $118.75K ASP = $250.325 million
- Model 3: 24,100 units X $60K ASP = $1.446 billion
- Model X: 2,576 units X $130K ASP = $334.88 million
Total Sales: $2.031 billion
China - 12%
- Model S: 903 units X $132.5K ASP = $119.648 million
- Model 3: 10,329 units X $55K ASP = $568.1 million
- Model X: 1,104 units X $140K ASP = $154.56 million
Total Sales: $842.31 million
Tesla Q4 Total Automotive Sales by Unit:
- Model S: $810.283 million
- Model 3: $4.596 billion
- Model X: $1.08 billion
Total Automotive Sales: $6.486 billion
Other/Total Sales Estimates:
- Automotive Leasing: $275 million
- Energy Generation and Storage: $420 million
- Services and Other: $550 million
- Automotive Sales: $6.486 billion
Tesla Total Q4 Sales: $7.731 billion
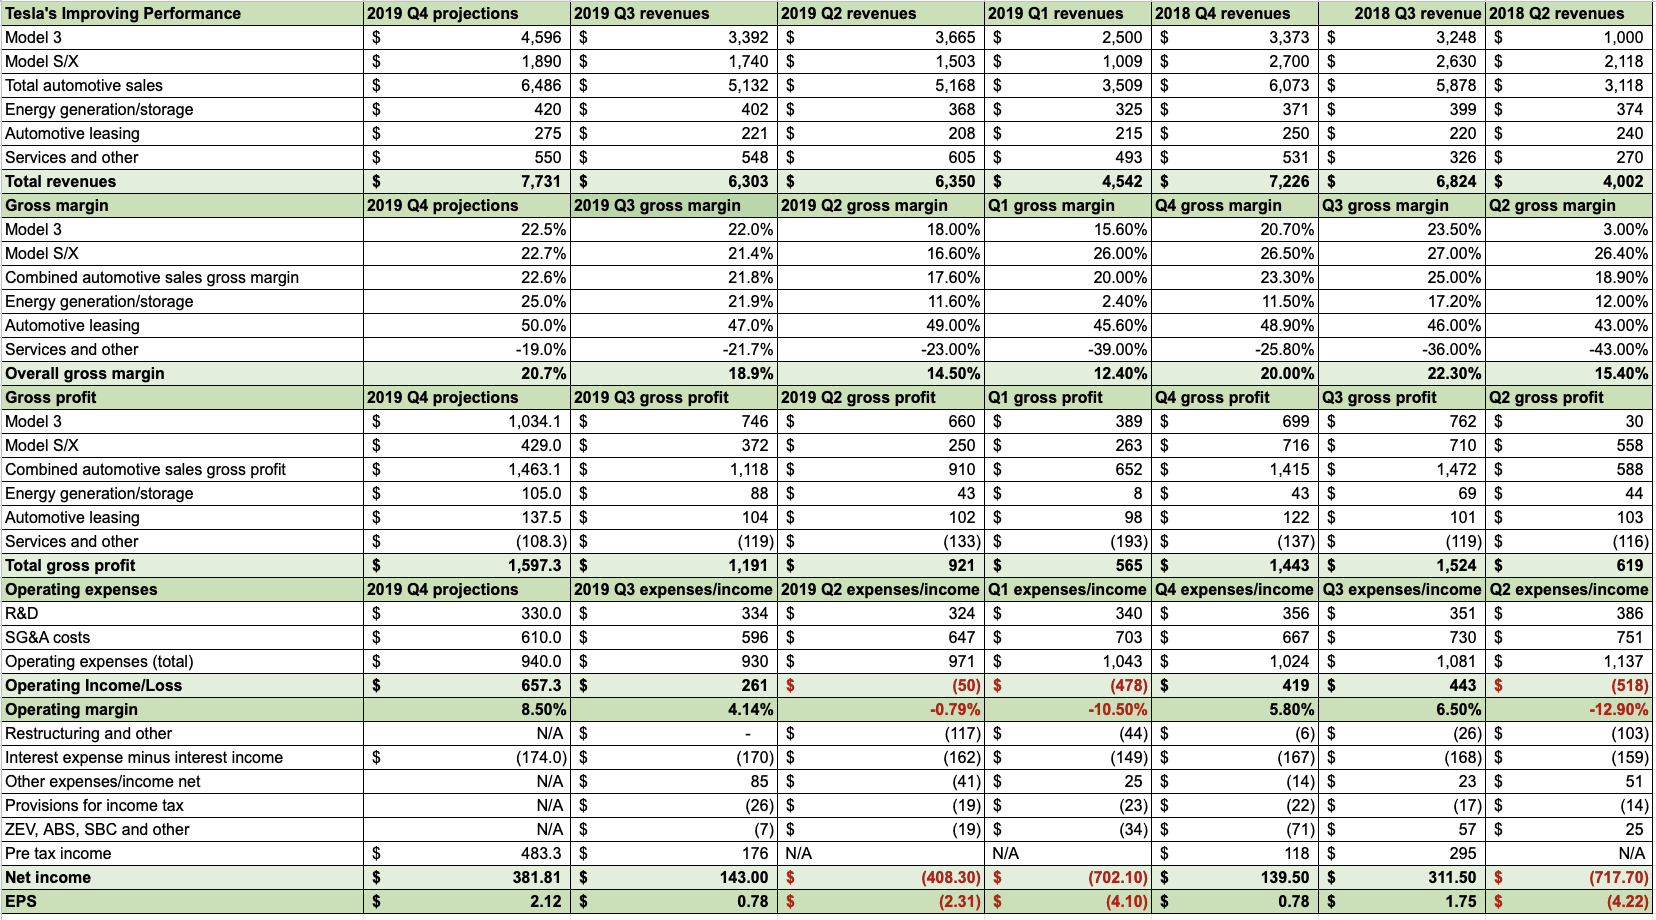
Q4 Projections Vs. Prior Quarterly Results
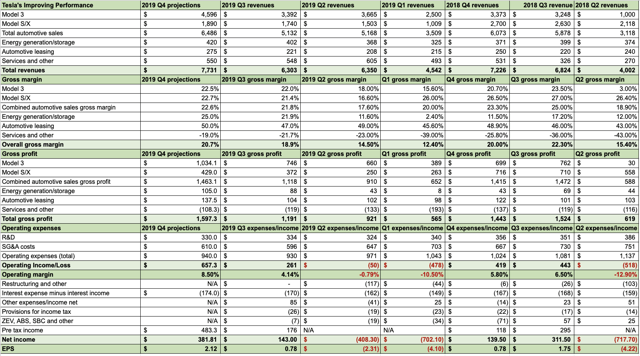 Source: Author's Material
The Bottom Line: Tesla Likely to Beat Estimates
Source: Author's Material
The Bottom Line: Tesla Likely to Beat Estimates
Due to higher than anticipated ASPs outside the U.S., continuous improvements in production efficiency, and lower operating expenses Tesla is likely to beat most top and bottom line estimates for Q4. The consensus estimate on the street is for revenues of
$7.02 billion and for income of $1.72 per share.
However, my estimates point to revenues of slightly over $7.7 billion, and EPS of around $2.12 per share. If my estimates are correct this will represent a YoY revenue increase of about 7% and an EPS increase of roughly 10%. Moreover, this puts the company in a prime position to beat next year’s revenue and EPS figures. Right now, consensus figures point to revenues of around $30.5 billion and EPS of around $6 per share.
Nevertheless, given the company’s momentum and its better than anticipated execution, it seems plausible that Tesla can hit higher-end estimate revenue targets, possibly closer to
$40 billion this year. The company also may record EPS closer to higher end estimates of $14. I expect Tesla to earn around $10-12 per share this year. This would put its forward P/E ratio at around 46 to 56 times this year’s earnings.
Also, if the company can achieve roughly $40 billion in revenues this year it will be a remarkable 60% YoY increase in sales, making its 46-56 forward P/E multiple relatively inexpensive considering Tesla’s rapid growth rate.
The stock has moved up dramatically in recent months. In fact, the stock has more than tripled since the lows of mid-2019, and is up by around 220% since then. The chart is vertical and there will likely be a correction that may bring Tesla’s shares back down to around the $500 level, possibly lower, especially if Q4 profitability is not as high as some analysts are anticipating.
Nevertheless, any significant correction in the stock will likely represent a compelling buying opportunity as shares are likely to continue to appreciate long term as the company continues to increase revenues, deliver profits, and capture more market share in the automotive space and other sectors.
https://seekingalpha.com/article/4318581-why-tesla-continues-surge