"Trumpiness is a strong indicator of a high Covid death rate, as shown by this list of the most deadly 100 counties in the USA".
This should not surprise anyone -- Trump voting counties have the highest per capita COVID Death and Case rates.
Weekly Update: Which COUNTIES have the highest per capita rates of #COVID19 cases and deaths?
Sat, 03/06/2021 - 12:01pm
https://acasignups.net/21/03/07/wee...highest-capita-rates-covid19-cases-and-deaths
The data below comes from the GitHub data repositories of Johns Hopkins University, except for Utah, which comes from the GitHub data of the New York Times due to JHU not breaking the state out by county but by "region" for some reason.
Important:
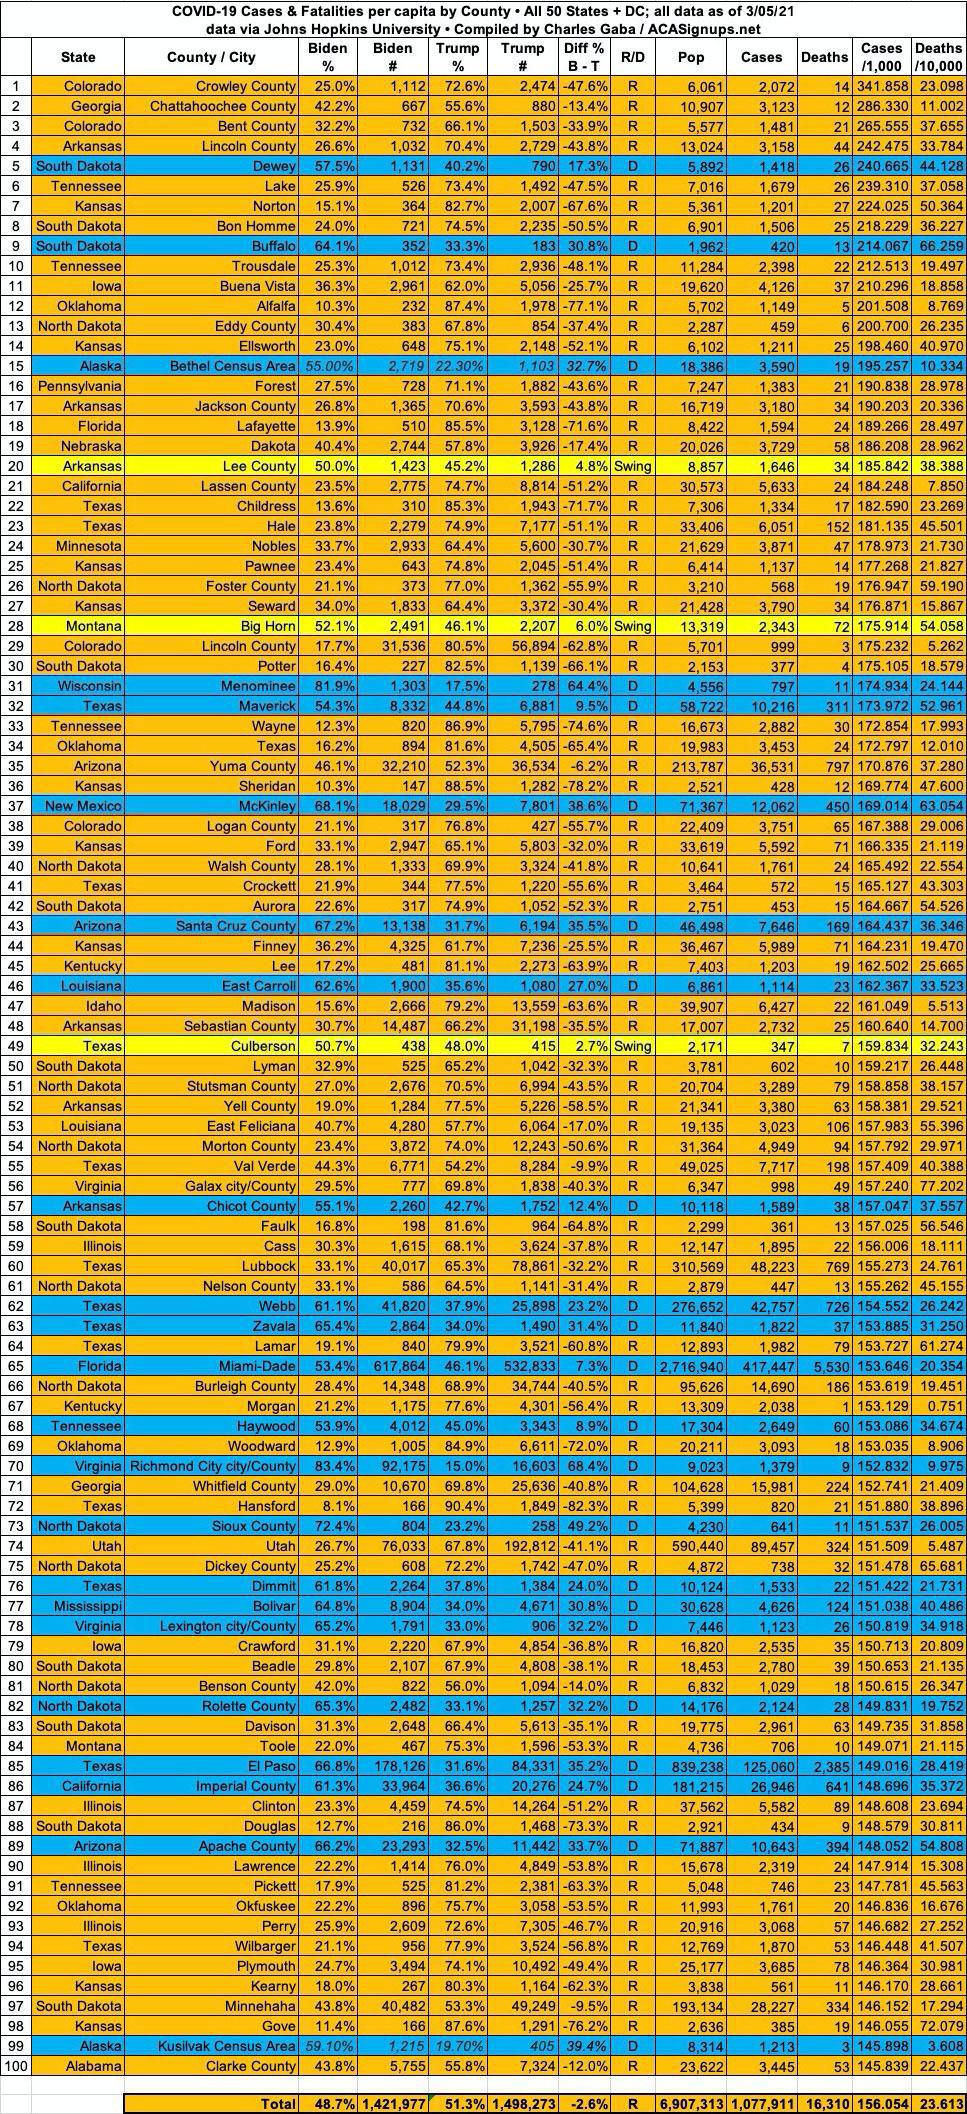
Crowley County, Colorado still holds the #1 spot. 2,072 of their 6,061 residents have now tested positive for #COVID19, or 34.1% of their total population.
For what it's worth, the top 100 top counties voted for Donald Trump by 2.6 points.
Here's the top 100 counties ranked by per capita COVID-19 fatalities as of Friday, March 5th, 2021
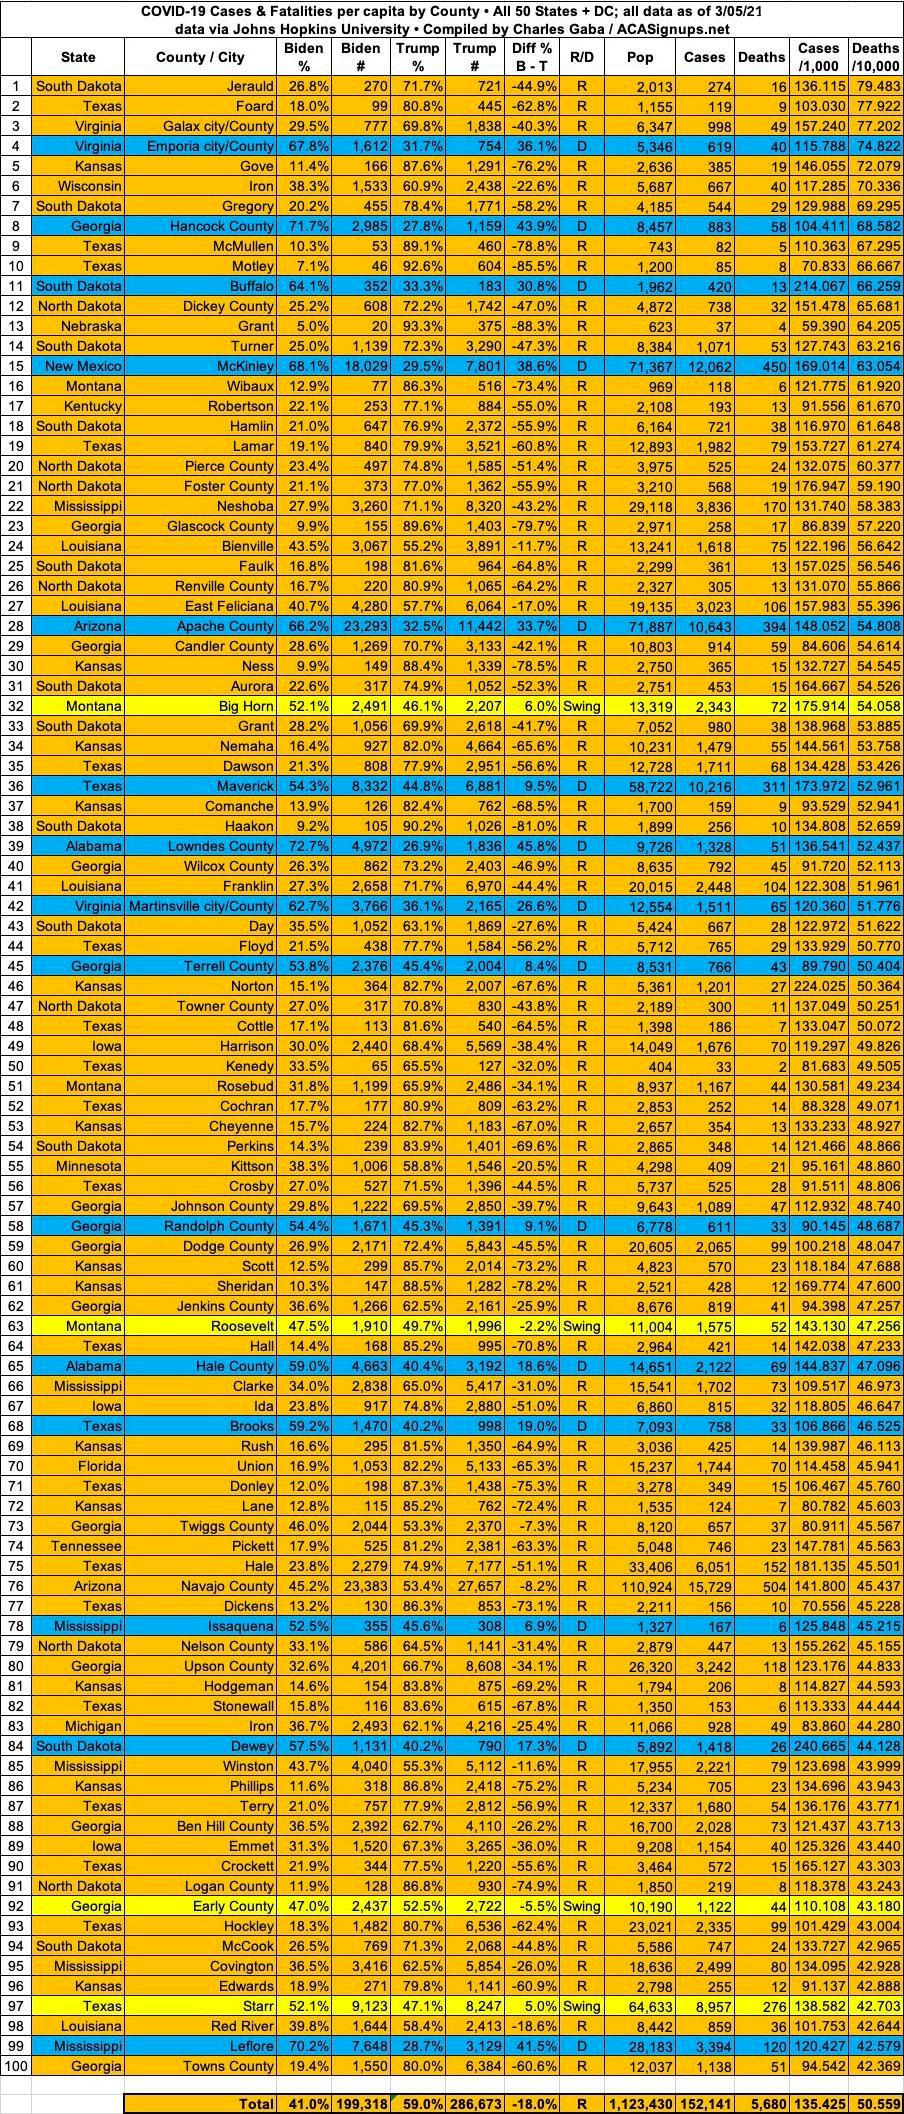
The #1 spot is still Jerauld County, South Dakota, where 16 out of the county's 2,013 residents have died of COVID-19, or 0.8%. That's 1 out of every 125 residents.
The 100 counties with the highest COVID-19 death rates voted for Donald Trump by 18 points.
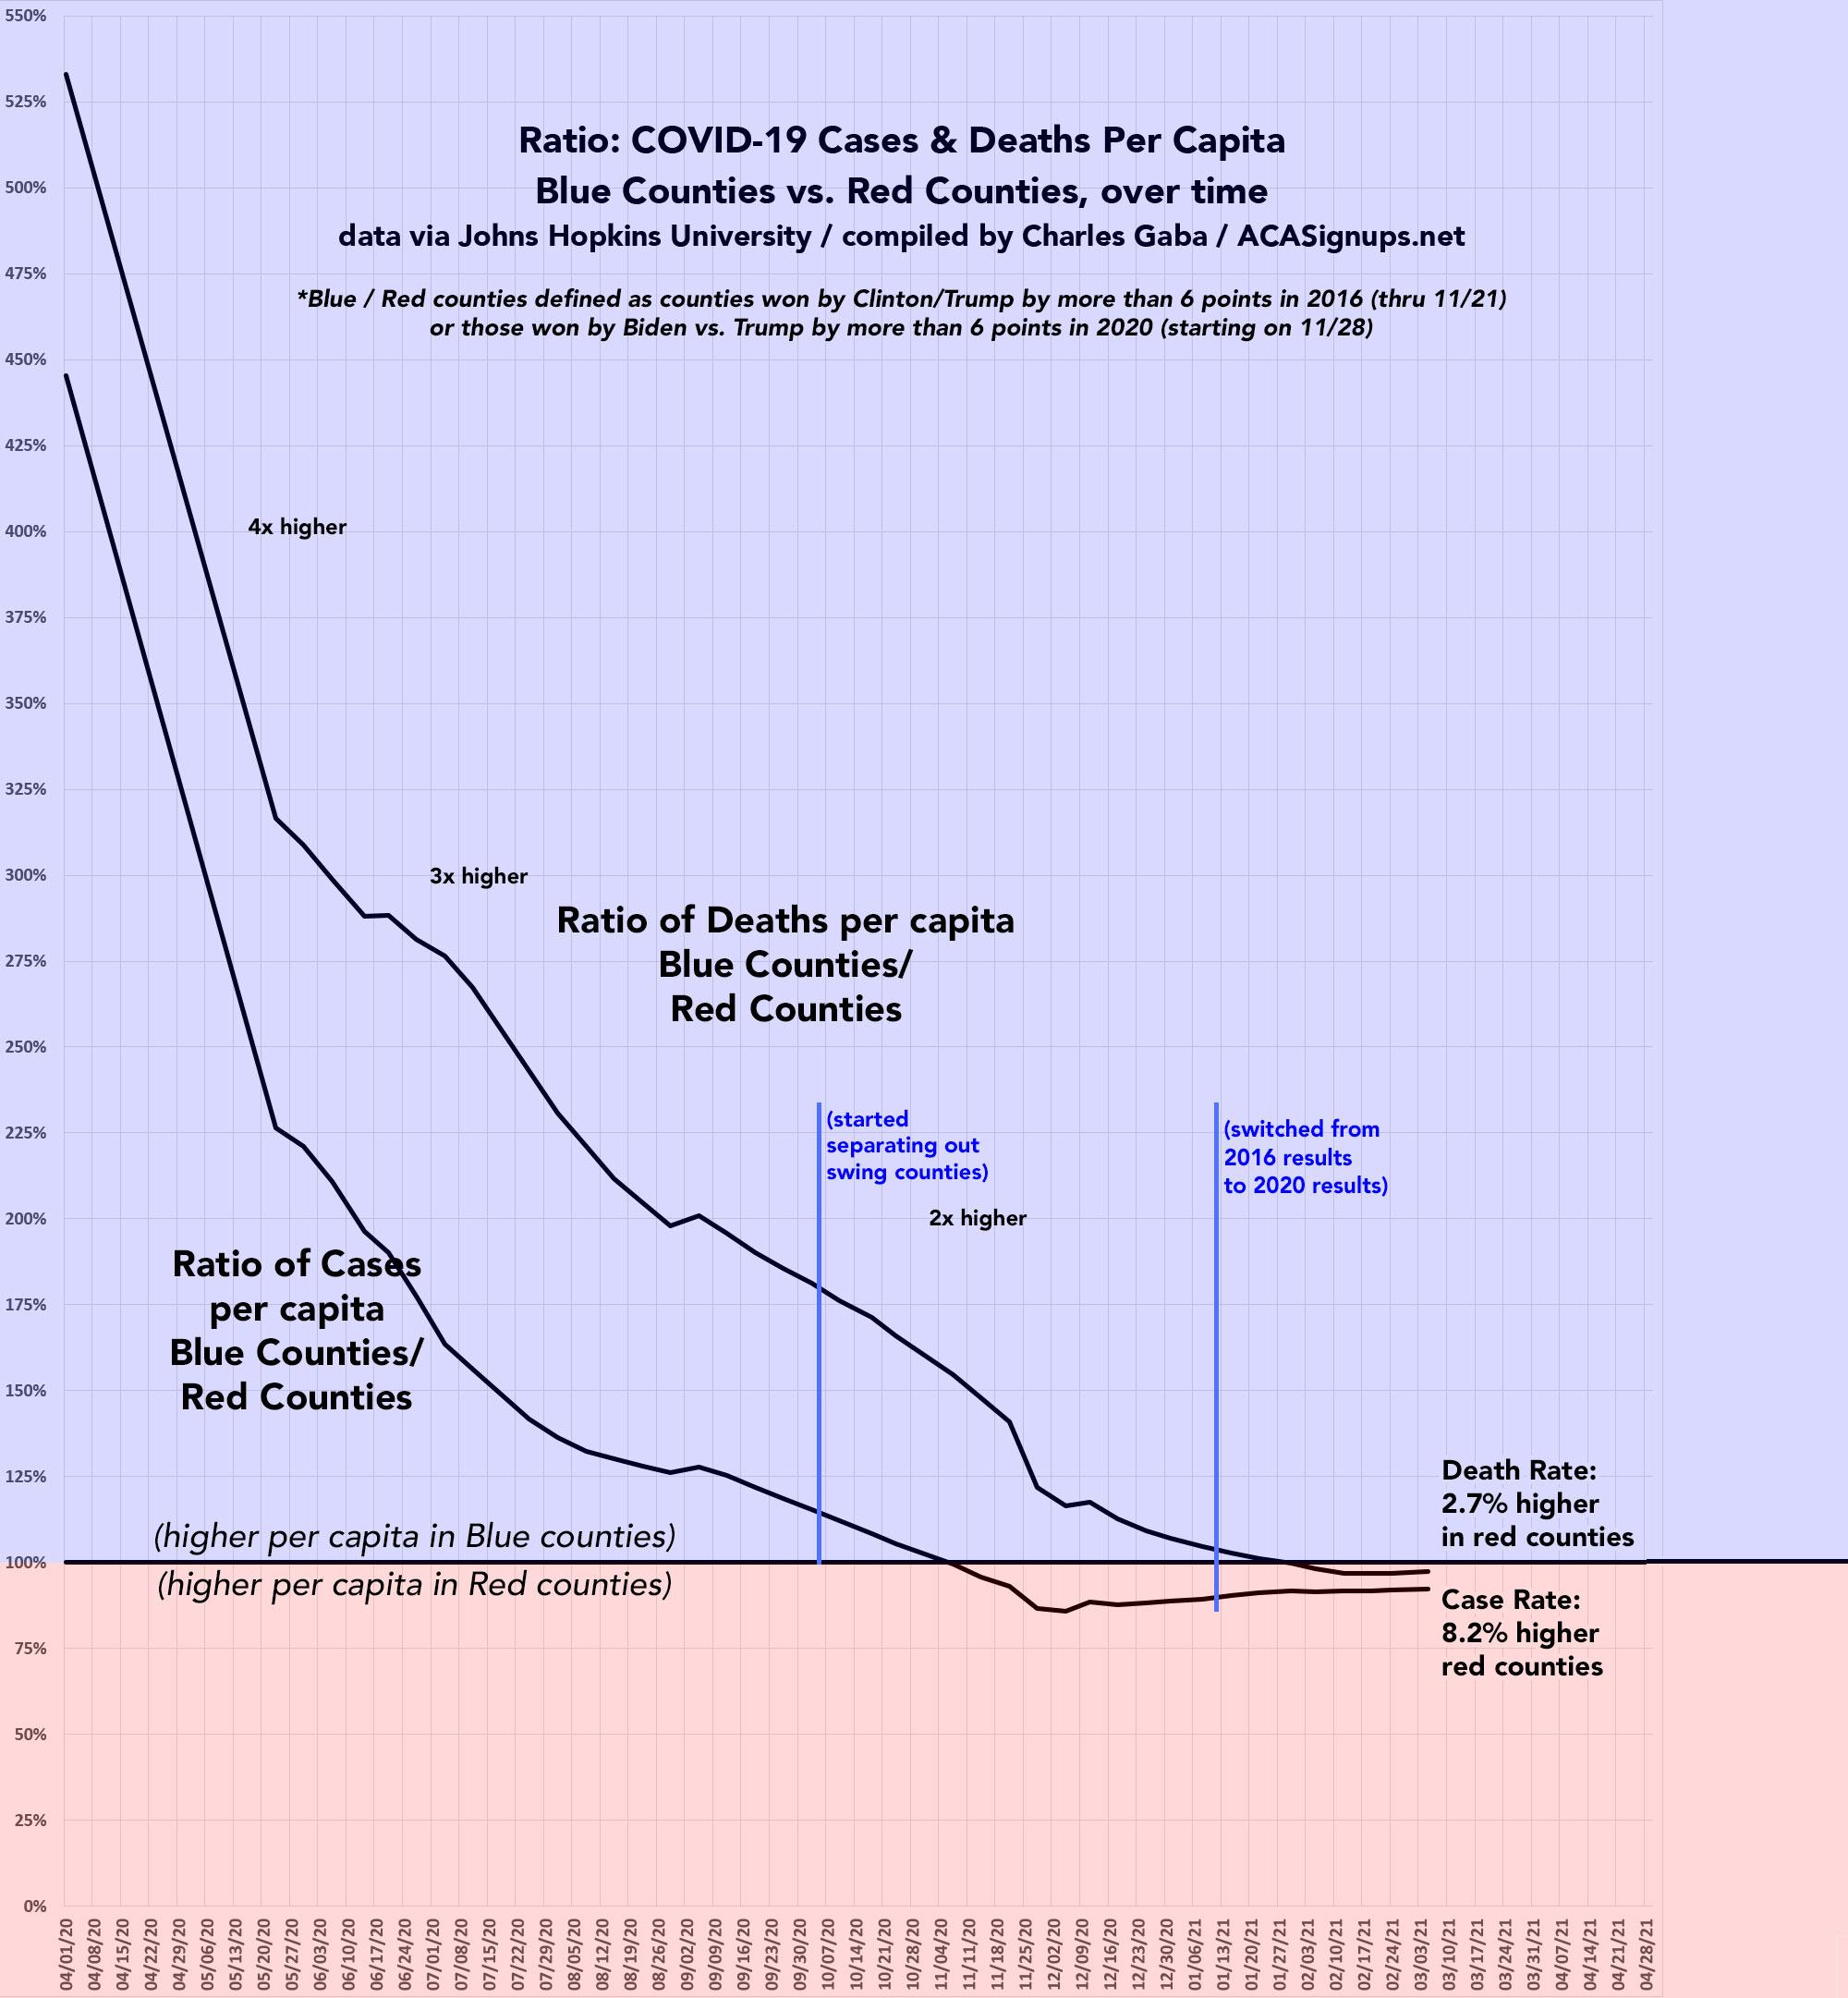
It's also worth noting how the ratio of per capita cases and mortality have shifted between the Blue and Red-leaning counties over time.
Back in mid-March, the case rate was 450% higher and the mortality rate was 530% higher in blue counties than red counties (defined as counties which voted for Hillary Clinton or Joe Biden vs. Donald Trump). Due to my updating most of the counties to reflect the 2020 results instead of 2016, the lines for both cases and deaths per capita jumped around a bit for a few weeks as I updated counties in all 50 states, but they've now mostly settled back into the same pattern, continuing to shift from blue to red.
As of today, both cumulative COVID-19 Cases and Deaths per capita are running higher in the Red Counties:
I've also taken a look at the counties with the lowest rates of COVID-19 cases and fatalities:
This should not surprise anyone -- Trump voting counties have the highest per capita COVID Death and Case rates.
Weekly Update: Which COUNTIES have the highest per capita rates of #COVID19 cases and deaths?
Sat, 03/06/2021 - 12:01pm
https://acasignups.net/21/03/07/wee...highest-capita-rates-covid19-cases-and-deaths
The data below comes from the GitHub data repositories of Johns Hopkins University, except for Utah, which comes from the GitHub data of the New York Times due to JHU not breaking the state out by county but by "region" for some reason.
Important:
- Every county except those in Alaska lists the 2020 Biden/Trump partisan lean; Alaska still uses the 2016 Clinton/Trump results (the 2020 Alaska results are only available by state legislative district, not by county/borough for some reason...if anyone has that info let me know)
- I define a "Swing District" as one where the difference between Biden & Trump was less than 6.0%. FWIW, there's just 187 swing districts (out of over 3,100 total), with around 33.7 million Americans out of 332 million total, or roughly 10.2% of the U.S. population.
- For the U.S. territories, Puerto Rico only includes the case breakout, not deaths, which are unavailable by county equivalent for some reason.
- Blue = Joe Biden won by more than 6 points
- Orange = Donald Trump won by more than 6 points
- Yellow = Swing District (Biden or Trump won by less than 6 points)
Crowley County, Colorado still holds the #1 spot. 2,072 of their 6,061 residents have now tested positive for #COVID19, or 34.1% of their total population.
For what it's worth, the top 100 top counties voted for Donald Trump by 2.6 points.
Here's the top 100 counties ranked by per capita COVID-19 fatalities as of Friday, March 5th, 2021
The #1 spot is still Jerauld County, South Dakota, where 16 out of the county's 2,013 residents have died of COVID-19, or 0.8%. That's 1 out of every 125 residents.
The 100 counties with the highest COVID-19 death rates voted for Donald Trump by 18 points.
It's also worth noting how the ratio of per capita cases and mortality have shifted between the Blue and Red-leaning counties over time.
Back in mid-March, the case rate was 450% higher and the mortality rate was 530% higher in blue counties than red counties (defined as counties which voted for Hillary Clinton or Joe Biden vs. Donald Trump). Due to my updating most of the counties to reflect the 2020 results instead of 2016, the lines for both cases and deaths per capita jumped around a bit for a few weeks as I updated counties in all 50 states, but they've now mostly settled back into the same pattern, continuing to shift from blue to red.
As of today, both cumulative COVID-19 Cases and Deaths per capita are running higher in the Red Counties:
- Cumulative Cases per 1,000 residents: Red Counties: 91.1; Blue Counties: 84.2 (8.2% higher in Red Counties)
- Cumulative Deaths per 10,000 residents: Red Counties: 16.1; Blue Counties: 15.7 (2.7% higher in Red Counties)
I've also taken a look at the counties with the lowest rates of COVID-19 cases and fatalities:
- There are now just 50 counties nationwide which haven't reported any COVID-19 deaths as of yet, down from 52 a week ago.
- There are only 3 counties nationwide which haven't reported any cases yet:
- Bristol Bay Borough, Alaska
- Hoonah-Angoon Census Area, Alaska
- Kalawao County, Hawaii