
An old, (2004-2005) manipulation of statistics (Methodology not disclosed, but certainly leaves out major elements), created by author Jesse Erlbaum (Who has New York Magazine and the United Nations as clients), and reported by CNN, (A biased and discredited news source). In other words, another propaganda piece created by Leftist Organizations in an attempt to obscure the inherent superior productivity of Conservatives.
An analysis of respective state budgets, including taxes, would show the whole truth. I actually did briefly review some state budgets, especially California, and found taxes and huge regulatory fines for the most minor non-compliance on business with a large proportion of revenue going towards Democrat pet projects. In Oregon, state taxes on diesel are six times the average of Red states, effectively making all roads toll roads for drivers of diesel vehicles. While Washington state does not have a personal income tax, they have high sales taxes rates, high fees on many business activities, and high real estate transaction fees. Washington state is notorious for kickback laden, unnecessary infrastructure projects with city councils illegal and or unethically over-riding public voting on certain projects, without subsequent prosecution or other remedies applied.
If Conservatives actually spent some time doing research, we certainly don’t seem to hear about it. Maybe Conservatives are too busy running businesses and helping keep people employed instead of busily manipulating statistics and disseminating propaganda as those on the Left always seem to be doing.

You are using an out of date browser. It may not display this or other websites correctly.
You should upgrade or use an alternative browser.
You should upgrade or use an alternative browser.
Trumpers should read this
- Thread starter Cuddles
- Start date
An old, (2004-2005) manipulation of statistics (Methodology not disclosed, but certainly leaves out major elements), created by author Jesse Erlbaum (Who has New York Magazine and the United Nations as clients), and reported by CNN, (A biased and discredited news source). In other words, another propaganda piece created by Leftist Organizations in an attempt to obscure the inherent superior productivity of Conservatives.
An analysis of respective state budgets, including taxes, would show the whole truth. I actually did briefly review some state budgets, especially California, and found taxes and huge regulatory fines for the most minor non-compliance on business with a large proportion of revenue going towards Democrat pet projects. In Oregon, state taxes on diesel are six times the average of Red states, effectively making all roads toll roads for drivers of diesel vehicles. While Washington state does not have a personal income tax, they have high sales taxes rates, high fees on many business activities, and high real estate transaction fees. Washington state is notorious for kickback laden, unnecessary infrastructure projects with city councils illegal and or unethically over-riding public voting on certain projects, without subsequent prosecution or other remedies applied.
If Conservatives actually spent some time doing research, we certainly don’t seem to hear about it. Maybe Conservatives are too busy running businesses and helping keep people employed instead of busily manipulating statistics and disseminating propaganda as those on the Left always seem to be doing.

The money spent by public assistance recipients is apparently counted in the statistics you are citing, skewing results and reasonable conclusions. The following is a map of the 2018 map showing results by precinct. While the 2018 map is not the 2016 or 2020 Presidential map, it may be reasonable for them to look similar. In 2020, Biden won even less precincts than Hillary, making the 2020 election map by precincts, when it finally finished and comes out, even more stark to the detriment of Democrats:
https://static01.nyt.com/images/201...inctMapLN-superJumbo.png?quality=90&auto=webp
No wonder you like to post voting results by county. The results look better because precincts won by Republicans are obscured.
Public assistant recipients, ex-felons, minorities, and major city dwelling apartment renters overwhelmingly vote Democrat. After taking consideration for those voters, whose left? Again, the most productive voters are home owning employed Conservatives who are not easily taken in by Leftist propaganda.
Tax rate per capita times population are called tax receipts. Tax receipts divided by population are taxes paid per capita.
Let’s run the math for the top 4 using your tax revenue figures and by state population figures:
1 1 California population, 39,368,078. Taxes per capita, $4974.
2 2 Texas Population, 29,360,759. Taxes per capita, $2157.
3 4 Florida Population, 21,733,312. Taxes per capita, $2061
4 3 New York Population, 19,336,776. Taxes per capita, $4738.
The figures below include population changes and other things, but no taxes per capita calculations.
5 6 Pennsylvania 12,783,254 12,702,379 0.6% +80,875 18 4.14% 639,163 710,181 705,688 3.84% 4.06% –0.22% 3.72%
6 5 Illinois 12,587,530 12,830,632 –1.9% –243,102 18 4.14% 629,377 699,307 712,813 3.78% 4.10% –0.32% 3.72%
7 7 Ohio 11,693,217 11,536,504 1.4% +156,713 16 3.68% 649,623 730,826 721,032 3.51% 3.69% –0.18% 3.35%
8 9 Georgia 10,710,017 9,687,653 10.6% +1,022,364 14 3.22% 669,376 765,001 691,975 3.22% 3.10% 0.12% 2.97%
9 10 North Carolina 10,600,823 9,535,483 11.2% +1,065,340 13 2.99% 706,722 815,448 733,499 3.18% 3.05% 0.13% 2.79%
10 8 Michigan 9,966,555 9,883,640 0.8%
The population figures were obtained from wikipedia.org and partially reformatted above.
https://en.m.wikipedia.org/wiki/List_of_states_and_territories_of_the_United_States_by_population
Of note, most of the higher tax burden states have lower, sometimes negative, such as New York State, population growth. Even more notably, the ones with the higher tax burdens are more likely to change their domicile state to a lower tax state, increasing potential tax burdens for those that remain. I wonder how crime rates compare between Blue and Red states? Rhetorical question.
The underlying point is Democrat policies tend to push away the productive, creating long term economic hardship for those that remain. Many inner cities used to be the economic center of a city. After a few decades of Democrat policies, once productive areas are now in ruins.
Hopefully, the Biden Administration will not repeat the mistakes of the past and will be a President for all of us. If wondering what to do, the Biden Administration should lean on their beloved big tech friends and ask AI for some answers. AI’s answer will likely come up with “Vote Republican”.
The money spent by public assistance recipients is apparently counted in the statistics you are citing, skewing results and reasonable conclusions. The following is a map of the 2018 map showing results by precinct. While the 2018 map is not the 2016 or 2020 Presidential map, it may be reasonable for them to look similar. In 2020, Biden won even less precincts than Hillary, making the 2020 election map by precincts, when it finally finished and comes out, even more stark to the detriment of Democrats:
View attachment 252077
https://static01.nyt.com/images/201...inctMapLN-superJumbo.png?quality=90&auto=webp
No wonder you like to post voting results by county. The results look better because precincts won by Republicans are obscured.
Public assistant recipients, ex-felons, minorities, and major city dwelling apartment renters overwhelmingly vote Democrat. After taking consideration for those voters, whose left? Again, the most productive voters are home owning employed Conservatives who are not easily taken in by Leftist propaganda.
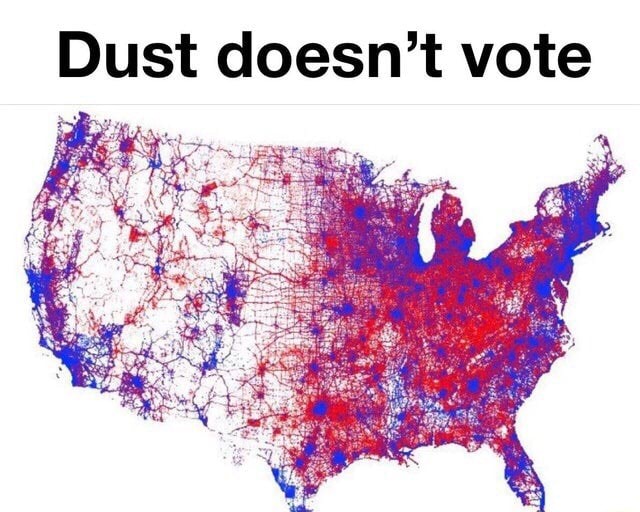
The underlying point is Democrat policies tend to push away the productive
Yet 70% of production is from blue states and blue cities.
The underlying point is Democrat policies tend to push away the productive
Yet the so called productive aren't moving to rural Mississippi ,Alabama and other shit hole areas that vote republican.
The productive vote for Dems increased from Hillarys 64% in 2016 to Bidens 70% in 2020.
https://www.wsj.com/livecoverage/latest-updates-biden-trump-election-2020/card/32vHNFTTc2xxNr7NITHY
Their work shows an increasing divide between a high-output, Democratic-leaning part of the nation and a lower-output, Republican-leaning set of communities. In 2016, Brookings analysts found, Democrat Hillary Clinton won counties accounting for 64% of economic output, compared with Mr. Biden’s 70% share. Mr. Trump in 2016 won counties accounting for 36% of economic output, compared with his share of under 30% this year.
Yet 70% of production is from blue states and blue cities.
The Democrats did not get anywhere near 70% of the vote and what do ex-felons and public assistance recipients produce again? By the way, an interesting metric to consider is per capita tax burden of working class people in Blue states versus Red States, instead of using per capita for the entire state’s population. After all, those on public assistance shouldn't be included in the per capita tax burden figures, right? Further, I wonder what the ratio of public assistant to total government outlays compares in Blue versus Red states. Blue states with higher public assistance payouts tend to attract those, both foreign and domestic, who may be looking for the best payouts, like some members of my own family have done.
So there it is, Democrat policies redirect wealth from earners to non-earners, increasingly chasing away the earners while attracting to non-earners and increasing the need to raise taxes even more. Relative population growth in high population Blue states versus Red states tell the story, with Red states on average significantly outperforming Blue states. It is any wonder why Democrat policies fail in the long term? Democrats may be able to buy votes using public money, but for those that remain under their governance, it could be the most expensive, long term decision they make.
It is any wonder why Democrat policies fail in the long term? .
They dont,which is why the biggest economic states and cites and federal government revenue come from blue states and blue cities.That is an undisputed fact no matter how much you want to bullshit around it.
Relative population growth in high population Blue states versus Red states tell the story, with Red states on average significantly outperforming Blue states.
Going to democrat run cities like Houston,Atlanta,Dallas etc.People aren't moving to confederate state republican run shit hole rural Trump supporting areas.