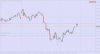
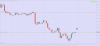
I was stopped out of CADJPY, which prompted me to want to see things from more of a bird’s-eye view, and this in turn led me to try something I’ve never done before, which is to not only consult a four-hour chart, but to also rely on it as the main chart for regulating market entries.
NOTES TO SELF:
The four-hour candlesticks on my OANDA MT4 charts form at 2AM, 6AM, 10AM, 2PM, 6PM, and 10PM in my time zone. (If you wish, you only have to check on how things are progressing at these six points during the day.)
There are three levels of extreme separation from the core moving average. The most conservative method for making the decision to execute a trade based on these extremes is to do so when a candlestick forms on the side of the shorter-term moving average that is nearer to the core moving average.
A more aggressive method for making this decision is when the initial candlestick of the opposite color forms within these extreme zones.
AUDJPY is currently at the outer extreme, so try entering a long position following the formation of a green candlestick. The conservative “let your profits run” take profit-target is the shorter-term moving average. (This only applies if the more aggressive method of entering positions is used.) When you are ready to test a more ambitious target, use the core moving average.
AUDUSD is currently at the second level of extreme deviation, as is CADJPY.
EURAUD is at the second level of extreme deviation to the north.
NZDJPY is at the first level to the south, and believe it or not, @ 1.3388 USDCAD is only at the first level to the north. It would actually have to climb all the way up to 1.3481 before the numbers would suggest it more than likely was being compelled by maximum pressure to regress toward the mean.
The third method of judging when to execute trades is following a reversal in the core trendline, but to maximize safety, when it is believed that this is occurring, probably the only type of trade that should be executed is one of the “touch and go” variety.