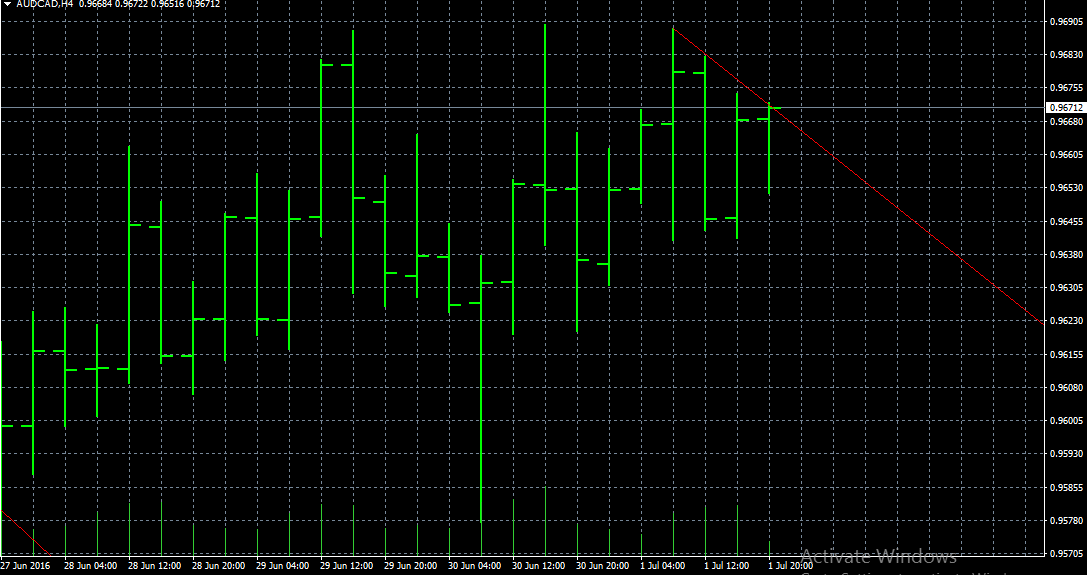
Btw what i dont get is , do you draw lines on last part of the chart and what if a pattern isnt possible to draw? (seems to happen often)
First I do not believe any "pattern" is impossible to draw - other wise it is not a "pattern"
Setting that aside - then price is screaming a message..., or two - what could that be..., hmmm
1. one month chart , is the drawing and spot of analysis correct? it is a resistance trendline , now can i assume for ex that if its crossed during the next days , it will probably mean an uptrend? should i analyze the whole chart?
This is trading - assuming anything will get you broke
You trading off the 1 Month - iow.., what is your TTF (rhetorical)
Does the 1 Month provide you low risk signals
2. is this a triple top? if the price surpass the line can i assume a trend begin? i t hink that one required at least more than one month? but where do i find charts like this?
Could be
Could also be a range / range forming
Could be a PB in an upmove
Could be a reversal
What one labels it - who gives a shit
Its what we do with the information that counts
Several problems:
1. I need a software that automatically draw patterns and has a lot of them so i can see how drawing works on a real chart like the ones i posted above and whats needed for a pattern to be valid
2. I can only draw patterns between peaks of 1-2 days difference , i think some patterns like head and shoulder required much bigger time , where do i find those charts?
3. Its impossible to draw a pattern on some charts , do i give up on these charts and say that i have no strategy for them?
I respectfully suggest:
Simplification
Clarification
Focus on the TTF you're trading
And as H123 suggested - more seat time..., hand drawing charts is also an excellent endeavor
jmdao of course
RN