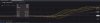
Those are old (couple of years ago) pre-earnings vol curves of GOOGL and AMZN.
So you trade on years-old data? The premise (of this thread) is cheap wings...

Those are old (couple of years ago) pre-earnings vol curves of GOOGL and AMZN.
So you trade on years-old data? The premise (of this thread) is cheap wings...
Just
Just showing an example of a humped-shape pre-earnings curve where the wings are a lot cheaper than the ATMs. Didn't have time to pull up a current example.
Alright. I trade a lot of SN-vol and I've not seen wings under ATM in many years. Long enough that I cannot recall.
I don’t recall EVER seeing both wings lower than ATM in the 18 years I have traded vol. The same sometimes.
The earnings month smile shape usually has a big hump of very high IVs around the ATM strike, with the OTM wing IVs trading much cheaper.
The shares gap and they will guarantee a price? How?
See how much Buy/Sales going on during the Up Move on Earnings? With extended Hours Trading you can get in and out, there are loads of Bids and Asks lined up. It's worse in a Black Swan Event, where you don't have noone along the Bids/Asks lined up. I can't think of an Earnings Event where I didn't get filled. But then again, I stay away from Volatile Stocks like Tesla when selling Options
Some peoples MO seems to be saving as much money as possible on their funeral catering. I think you got corrected by 3 ppl during this thread. You have no idea how to trade CFDs or Volatility. Hence I blocked you dumb cunt