Hello all. Dbp or anyone else that can assist please. I have read the SLA-AMT pdf, and gone through a couple of dbp threads including the one that deals with just SLA (house of if you can draw a straight line). However, there are still a few of things I am not clear about.
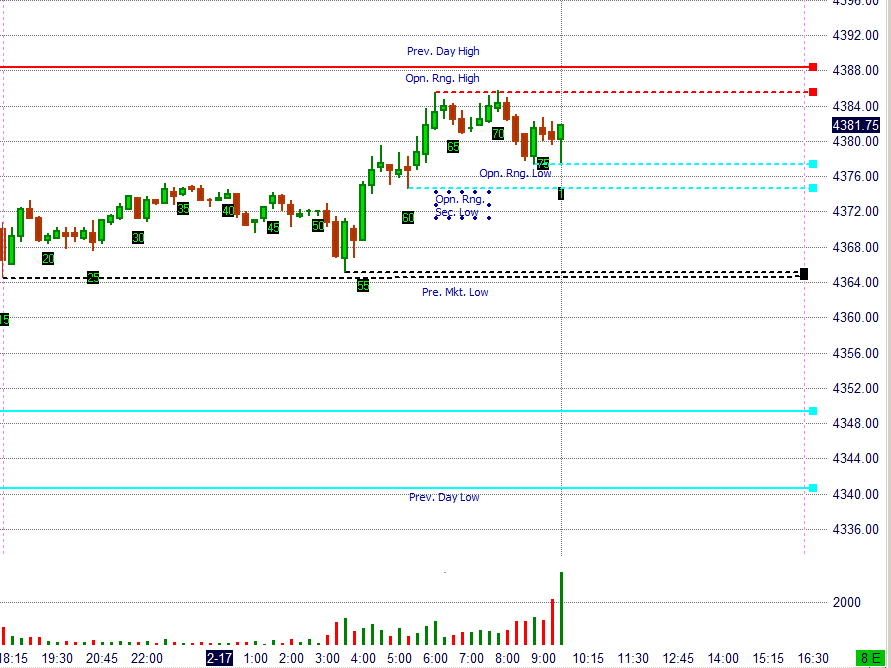
1) With reference to the attached chart, counting from the bar annotated with yellow arrow (that broke the DL), at which bar a retrace as per the SLA has taken place? This is something that has not been shown clearly by dbp. He talks about short entry a few ticks below a crest (upside down V), and long entry a few ticks above a through (V). This seems to imply the retrace has to form a V or U shape, implying a one bar retrace doesn't count?
2) Dbp also mentions entry after the first retrace. So does this mean even if you have a long continuous DL or SL line with several retraces (but hasn't been broken), and you missed the first retrace for whatever reason, you should not enter any trade until that DL/SL is broken?
3) Does the trend channel (just like the box and hinge) apply only to AMT? If one is concentrating solely on the SLA method, then should one disregard these. I believe dbp mentions AMT applies to 'mean reverting' instruments, so in effect, it would appear the TC, box and hinge do not apply to 'non-mean reverting ' instruments like FX or equities. Is that correct assumption?
View attachment 149485
1. If you're reading the chart from left to right or trading it in real time (in which case you have no other choice), the retracement begins with the first bar after your yellow arrow. You can't know in real time how deep the ret will be or how long it will take. To say that it's not complete until the fourth bar is a hindsight conclusion. Granted the ret is not confirmed until the fourth bar, but you don't know that in real time.
It will also be helpful to develop the habit of following the right tick. This is what illustrates the movement. All you can see in a static chart is the "close", but in real time that tick is moving up and down for a minute, and it tells you a great deal about what traders have in mind if you pay attention. This is one of the chief purposes behind observing without concerning oneself with finding trades.
As for the "few ticks", that's up to the trader. He may want to place his entry stop below the swing low in this case, i.e., where you have your arrow. In this way, he knows when his stop is triggered that the ret has at the same time been confirmed. The problem is that he will also be late. In any event, it is important that the market stop the trader into the trade by moving in his direction. Otherwise he's just jumping in and hoping that he's right. Entries might also and probably will change depending on the time of year and the volatility of the market. A fast-moving market is not going to take the time to wait for you to make up your mind. You have to be ready to act and do it. Other markets are more leisurely, and you have plenty of time to decide (of course they can be so leisurely that your trade wanders aimlessly for what seems like an interminable amount of time). Therefore, rather than obsess over the number of ticks, focus on whether or not you want to be in the trade. If you do, take it. If not, leave it alone. If your judgement was poor, you can exit the trade and evaluate your performance later, at your leisure.
2. You seem to have picked up the habit of reading from right to left, and you're going to have to get over this if you're going to develop the facility to read a chart competently and quickly. You can't know in real time whether the line is long and continuous or not, much less how many rets there are or where they will be. That's why you take the first. That doesn't mean you can't take a subsequent ret, but, first, you don't know whether or not there will be one, second, it may take so long that the move is well on its way and perhaps near its end before you ever get on board, and, third, you may be entering at a level where those who bought the first ret are already exiting their positions, which gives you that much more to overcome.
3. Trends and ranges are in the market. They are independent of you and whatever method you pursue to make profitable trades. Whether the trends form channels or not will depend on whether or not the instrument is mean-reverting (or, technically, median-reverting) as it is the mean that determines whether or not a channel will form (due to traders departing from it on a consistent basis). AMT applies to any instrument that is governed by the Law of Supply and Demand. Whatever "patterns" are formed are an unpredictable and perhaps even irrelevant consequence, i.e., traders don't do what they do in order to form a pattern; they do what they do in order to find and make a trade. If they're trading via charts, they don't even know what their behavior looks like, which is why it's more important to focus on the behavior rather than whatever "pattern" it appears to be forming.
As for how the SLA and AMT work together, I've gone into this in
the series of charts I posted to TL. Read those posts first.
As to boxes and channels, these are the result of price moving in one or the other of the two states available to it: trending and ranging. Sometimes these ranges form a regular, tradeable "box". Sometimes they don't. Sometimes the ranges look like a sonogram. A scalper may not care. But this isn't a scalping approach. Ditto trending. Sometimes the trends are so chaotic that only a scalper can benefit from them. But that doesn't mean they don't exist. A large part of
developing a plan is to find an instrument that moves in ways that provide you with the trading opportunities that you're looking for. If whatever you're looking at doesn't do that, why mess with it? It's not like there's a shortage of trading instruments out there. This is part of
the characterization process.
You will, by the way, find all this in the journals, but that's a lot of reading.
") It really sounds like you'd benefit from (re?)reading Mark Douglas' Trading In The Zone (just skip the 20% of it which is metaphysical weirdery). His simple exercise at the end could help set you free.
It really sounds like you'd benefit from (re?)reading Mark Douglas' Trading In The Zone (just skip the 20% of it which is metaphysical weirdery). His simple exercise at the end could help set you free.